Building AI-Powered Data Analytics with MindsDB: From Natural Language to Charts

Andriy Burkov, Ph.D. & Author, MindsDB Advisor

Data analytics traditionally requires writing SQL queries, understanding database schemas, and manually creating visualizations. This creates a significant barrier for business users who need insights but lack technical expertise. With MindsDB's Minds Enterprise you could simply ask questions in plain English and receive both answers and charts automatically.
In this tutorial, I will show how to build an AI-powered analytics system using MindsDB Minds that can:
Understand natural language questions about your data
Automatically generate and execute SQL queries
Return formatted answers with dynamically generated charts
By the end of this tutorial, you'll have a working system that transforms questions like "What's the total sales revenue by product category?" into actionable insights complete with visualizations.
What You'll Learn
Setting up a MindsDB Mind with database connectivity
Asking data questions to MindsDB Mind and getting answers programmatically
Prerequisites
Before starting, ensure you have:
Python 3.8 or higher installed
A MindsDB API key (please contact MindsDB to get one)
Basic familiarity with Python and SQL concepts
The following Python packages installed:
pandasopenaiminds-sdk(MindsDB Python client)
You can install the required packages with the following command:
pip install --upgrade pandas openai minds-sdk
pip install --upgrade pandas openai minds-sdk
pip install --upgrade pandas openai minds-sdk
pip install --upgrade pandas openai minds-sdk
The Dataset: Web Sales Analytics
This tutorial uses a web sales dataset stored in PostgreSQL available in your Minds dashboard. The dataset consists of four related tables that model an e-commerce business:
Table | Description | Key Columns |
|---|---|---|
| Order information |
|
| Sales transactions |
|
| Product catalog |
|
| Customer information |
|
Table Relationships
websales_sales.product_id  → websales_products.product_id
websales_sales.order_id    → websales_orders.order_id
websales_sales.customer_id → websales_customers.customer_id
websales_sales.product_id  → websales_products.product_id
websales_sales.order_id    → websales_orders.order_id
websales_sales.customer_id → websales_customers.customer_id
websales_sales.product_id  → websales_products.product_id
websales_sales.order_id    → websales_orders.order_id
websales_sales.customer_id → websales_customers.customer_id
websales_sales.product_id  → websales_products.product_id
websales_sales.order_id    → websales_orders.order_id
websales_sales.customer_id → websales_customers.customer_id
This schema supports a wide range of analytical questions — from product performance and customer segmentation to shipping analysis and regional trends.
For simplicity and to keep the focus on the Minds features, in this tutorial we used an existing dataset. Readers not familiar with the notion of data sources in MindsDB are invited to read this piece of documentation to learn how to make existing databases available for querying in MindsDB.
Step 1: Import Required Libraries
To start coding, let's import the necessary libraries for API communication, data handling, and MindsDB client operations:
import os, re, json
import pandas as pd
from openai import OpenAI
from minds.client import Client
import os, re, json
import pandas as pd
from openai import OpenAI
from minds.client import Client
import os, re, json
import pandas as pd
from openai import OpenAI
from minds.client import Client
import os, re, json
import pandas as pd
from openai import OpenAI
from minds.client import Client
The OpenAI library will be used as the API for communicating with a Mind. It's a popular choice of API supported by many chatbot and LLM providers. MindsDB supports it as well.
The Client is a MindsDB client we will use for Mind management.
Step 2: Configure API Credentials
Next, we set the MindsDB API URL, API key, and Mind name:
BASE_URL      = "https://mdb.ai/api/v1"
MINDS_API_KEY = "CREATE_YOUR_KEY" # "CREATE_YOUR_KEY at https://mindsdb.com/contact"
MIND_NAME     = "web_sales_demo_mind"
DATA_SOURCES  = [{
    'name': 'postgres_web_sales_datasource',
    'tables': [
        'websales_orders',
        'websales_sales',
        'websales_products',
        'websales_customers',
    ]
}]
Let's see what each parameter defines:
BASE_URLis the MindsDB API endpoint.MINDS_API_KEYis your personal API key for authentication. Create one at the MindsDB portal.MIND_NAMEis a unique identifier for your Mind. Choose a descriptive name that reflects its purpose.DATA_SOURCESspecify which database tables the Mind should have access to:nameis a reference name for this datasource configuration. This should match an existing datasource in your MindsDB environment.tablesis a list of table names the Mind is allowed to query. Restricting access helps the AI focus on relevant data.
Step 3: Initialize the MindsDB Client
With credentials configured, we now can create a client instance that handles all communication with the MindsDB platform:
client = Client(api_key=MINDS_API_KEY, base_url=BASE_URL)
client = Client(api_key=MINDS_API_KEY, base_url=BASE_URL)
client = Client(api_key=MINDS_API_KEY, base_url=BASE_URL)
client = Client(api_key=MINDS_API_KEY, base_url=BASE_URL)
The Client object provides methods for creating, updating, and managing Minds. It handles authentication automatically using the provided API key.
Step 4: Create the Prompt Template
The prompt template is the heart of your Mind's behavior. It instructs the AI on how to interpret questions, generate SQL, and format responses:
PROMPT_TEMPLATE = """
# ROLE AND TASK

You are a precise data analyst with access to a SQL execution tool named **sql_db_query**.
You MUST (a) generate SQL, (b) EXECUTE it via sql_db_query, and (c) based ONLY on the returned rows,
return the answer in markdown format and always create a chart whenever possible.
Generate URL-encoded charts via quickchart.io like this:

https://quickchart.io/chart?c=%7Btype%3A%27line%27%2Cdata%3A%7Blabels%3A%5B%27Jan%27%2C%27Feb%27%2C%27Mar%27%2C%27Apr%27%2C%27May%27%2C%27Jun%27%5D%2Cdatasets%3A%5B%7Blabel%3A%27Sales%27%2Cdata%3A%5B65%2C59%2C80%2C81%2C56%2C95%5D%2CborderColor%3A%27rgb(75%2C192%2C192)%27%7D%5D%7D%7D
https://quickchart.io/chart?c=%7Btype%3A%27pie%27%2Cdata%3A%7Blabels%3A%5B%27CompanyA%27%2C%27CompanyB%27%2C%27CompanyC%27%2C%27Others%27%5D%2Cdatasets%3A%5B%7Bdata%3A%5B35%2C25%2C20%2C20%5D%2CbackgroundColor%3A%5B%27%23FF6384%27%2C%27%2336A2EB%27%2C%27%23FFCE56%27%2C%27%234BC0C0%27%5D%7D%5D%7D%7D
https://quickchart.io/chart?c=%7Btype%3A%27bar%27%2Cdata%3A%7Blabels%3A%5B%27North%27%2C%27South%27%2C%27East%27%2C%27West%27%5D%2Cdatasets%3A%5B%7Blabel%3A%27Revenue%27%2Cdata%3A%5B120%2C190%2C300%2C250%5D%7D%5D%7D%7D

# SCHEMA (use schema-qualified names ONLY; do NOT include datasource name)
- postgres_web_sales_datasource.websales_orders     (order_id, order_date, ship_date, ship_mode, ...)
- postgres_web_sales_datasource.websales_sales      (order_id, product_id, customer_id, sales, quantity, discount, profit)
- postgres_web_sales_datasource.websales_products   (product_id, category, sub_category, product_name)
- postgres_web_sales_datasource.websales_customers  (customer_id, customer_name, segment, country, city, state, postal_code, region)

# JOINS

- websales_sales.product_id  -> websales_products.product_id
- websales_sales.order_id    -> websales_orders.order_id
- websales_sales.customer_id -> websales_customers.customer_id

# GUIDELINES

When answering questions, follow these guidelines:
    For questions about database tables and their contents:
    - Use the sql_db_query to query the tables directly
    - You can join tables if needed to get comprehensive information
    - **Important Rule for SQL Queries:** If you formulate an SQL query as part of answering a user's question,
    you *must* then use the `sql_db_query` tool to execute that query and get its results.
    The SQL query string itself is NOT the final answer to the user unless the user has specifically asked for the query.
    Your final AI response should be based on the *results* obtained from executing the query.
    For factual questions, ALWAYS use the available tools to look up information rather than relying on your internal knowledge.
"""
Lets see what we defined in the above prompt:
Section | Purpose |
|---|---|
ROLE AND TASK | Defines the AI's persona, core responsibilities, and provides URL-encoded QuickChart.io examples for the AI to learn the format |
SCHEMA | Documents available tables and their columns |
JOINS | Explains table relationships for multi-table queries |
GUIDELINES | Highlights the importance of following the execute-then-answer pattern |
None of these sections in the prompt are mandatory but they would help the AI to better understand your data and what you are trying to achieve.
Why QuickChart.io? Minds can generate plots without requiring the user to provide their own plotting API. These plots are currently available in the Minds UI. Because we are using Minds via the Python API, we will use an external service for plots. QuickChart.io generates chart images from URL-encoded JSON configurations, allowing charts to be embedded in Markdown without any client-side JavaScript.
Step 5: Create the Mind
With all components ready, we create the Mind. This registers the AI agent with MindsDB, connecting it to the specified datasource and prompt template:
mind = client.minds.create(
    name=MIND_NAME,
    datasources=DATA_SOURCES,
    parameters={
        'system_prompt': PROMPT_TEMPLATE
    },
    replace=True
)
mind = client.minds.create(
    name=MIND_NAME,
    datasources=DATA_SOURCES,
    parameters={
        'system_prompt': PROMPT_TEMPLATE
    },
    replace=True
)
mind = client.minds.create(
    name=MIND_NAME,
    datasources=DATA_SOURCES,
    parameters={
        'system_prompt': PROMPT_TEMPLATE
    },
    replace=True
)
mind = client.minds.create(
    name=MIND_NAME,
    datasources=DATA_SOURCES,
    parameters={
        'system_prompt': PROMPT_TEMPLATE
    },
    replace=True
)
Setting replace=True results in the new mind overwriting an old one with the same name.
Step 6: Create the OpenAI-Compatible Client
MindsDB exposes Minds through an OpenAI-compatible API. This means you can use the standard OpenAI Python client to interact with your Mind:
oa = OpenAI(api_key=MINDS_API_KEY, base_url=BASE_URL)
oa = OpenAI(api_key=MINDS_API_KEY, base_url=BASE_URL)
oa = OpenAI(api_key=MINDS_API_KEY, base_url=BASE_URL)
oa = OpenAI(api_key=MINDS_API_KEY, base_url=BASE_URL)
Step 7: Define Helper Functions
As you can see in a minute, we will interact with our Mind the same way as we usually interact with a chatbot. But first, we need several helper functions to handle API responses, extract the final answer from the AI's reasoning trace, and render Markdown output.
7.1 Non-Streaming Response Collection
For simple use cases where you don't need real-time output:
def collect_response(question):
    """
    Collect the final response from the Mind.
    """
    r = oa.chat.completions.create(
        model=MIND_NAME,
        messages=[{"role": "user", "content": question}],
        temperature=0.1
    )
    full_response = r.choices[0].message.content or ""

    return full_response
The low temperature=0.1 setting makes responses more deterministic — ideal for data analysis where consistency matters.
7.2 Streaming Response with Reasoning Trace
For a better user experience, streaming shows the AI's thinking process in real-time:
def stream_and_collect_response(question):
    """
    Stream the LLM response, print reasoning trace, but only return the final answer
    """
    print(f"\n=== QUESTION ===\n{question}\n")
    print("=== LLM REASONING TRACE START ===\n")

    completion = oa.chat.completions.create(
        model=MIND_NAME,
        messages=[{"role": "user", "content": question}],
        temperature=0.1,
        stream=True
    )

    full_response = ""

    try:
        for chunk in completion:
            if hasattr(chunk, 'choices') and chunk.choices:
                choice = chunk.choices[0]
                if hasattr(choice, 'delta') and choice.delta:
                    content = getattr(choice.delta, 'content', None)
                    if content is not None:
                        print(content, end='', flush=True)
                        full_response += content
    except Exception as e:
        print(f"\nStreaming error: {e}")
        # Fallback to non-streaming
        r = oa.chat.completions.create(
            model=MIND_NAME,
            messages=[{"role": "user", "content": question}],
            temperature=0.1
        )
        full_response = r.choices[0].message.content or ""
        print(full_response)

    print("\n")
    print("=== LLM REASONING TRACE END ===\n")

    # Extract only the final answer (everything after "I finished executing the SQL query")
    final_answer = extract_final_answer(full_response)

    return final_answer
This function provides transparency into the AI's decision-making process, showing the SQL it generates and executes before presenting the final answer.
7.3 Extract Final Answer
The AI's response includes both reasoning steps and the final answer. This function extracts just the user-facing content:
def extract_final_answer(full_response):
    """
    Extract the final answer from the full response using the end-of-reasoning marker
    """
    end_marker = "I finished executing the SQL query"

    # Find the position of the end-of-reasoning marker
    marker_pos = full_response.find(end_marker)

    if marker_pos != -1:
        # Extract everything after the marker
        final_answer = full_response[marker_pos + len(end_marker):].strip()
        return final_answer
    else:
        # Fallback: if marker not found, return the full response
        return full_response.strip()
The end_marker string acts as a delimiter between the AI's internal reasoning and the polished response meant for end users.
7.4 Render Markdown Output
Finally, we need to display the formatted response with charts rendered:
def render_markdown(response):
    """
    Render the markdown content generated by the Mind.
    """
    try:
        from IPython.display import Markdown, display
        display(Markdown(response))
    except ImportError:
        # Fallback for non-Jupyter environments: simply print the markdown string
        print(response)
In Jupyter environments, this renders charts inline. In other environments, it might print the raw Markdown (including chart URLs).
Step 8: Create the Main Query Interface
We wrap everything into a single, easy-to-use function:
def ask(question):
    """
    Ask a question to the mind, show reasoning trace, and return DataFrame
    """
    response = stream_and_collect_response(question)
    #response = collect_response(question)
    render_markdown(response)
def ask(question):
    """
    Ask a question to the mind, show reasoning trace, and return DataFrame
    """
    response = stream_and_collect_response(question)
    #response = collect_response(question)
    render_markdown(response)
def ask(question):
    """
    Ask a question to the mind, show reasoning trace, and return DataFrame
    """
    response = stream_and_collect_response(question)
    #response = collect_response(question)
    render_markdown(response)
def ask(question):
    """
    Ask a question to the mind, show reasoning trace, and return DataFrame
    """
    response = stream_and_collect_response(question)
    #response = collect_response(question)
    render_markdown(response)
This is the primary interface users will interact with — simply call ask() with a natural language question.
Example Queries and Results
Let's see the system in action with real business questions.
Query 1: Sales by Product Category
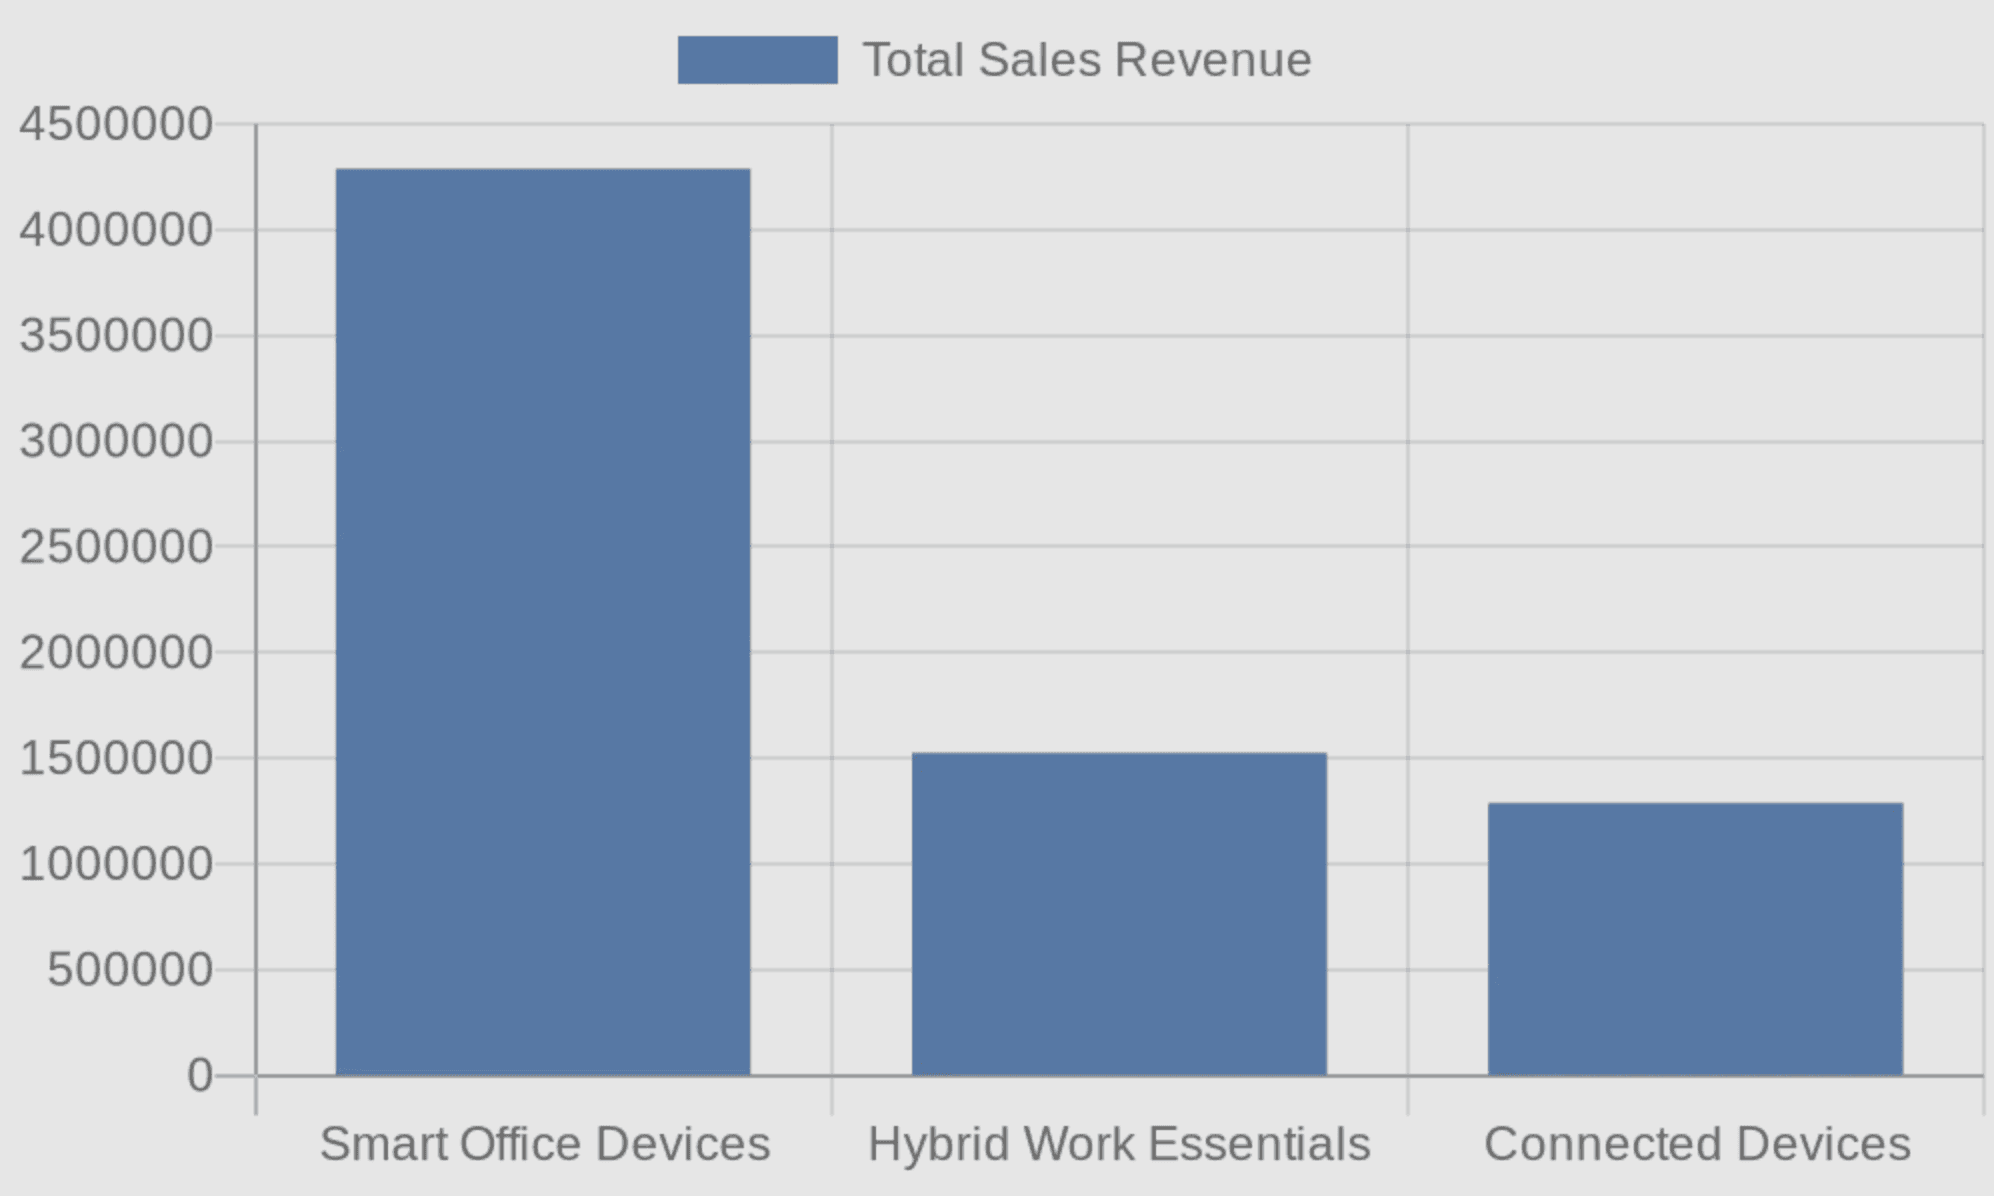
ask("What's the total sales revenue by product category?")
ask("What's the total sales revenue by product category?")
ask("What's the total sales revenue by product category?")
ask("What's the total sales revenue by product category?")
=== QUESTION === What's the total sales revenue by product category? === LLM REASONING TRACE START === I will now generate the SQL query to answer your question.Here is the generated SQL query along with its execution result: Query executed: SELECT wp.category, SUM(s.sales) as total_sales_revenue FROM postgres_web_sales_datasource.websales_sales s JOIN postgres_web_sales_datasource.websales_products wp ON s.product_id = wp.product_id GROUP BY wp.category Results: 3 rows x 2 columns category total_sales_revenue Hybrid Work Essentials 1525521.9 Smart Office Devices 4288440.0 Connected Devices 1288424.8 Here are the total sales revenues by product category: - **Smart Office Devices:** $4,288,440.00 - **Hybrid Work Essentials:** $1,525,521.90 - **Connected Devices:** $1,288,424.80 Here is a bar chart showing the sales revenue by category:  === LLM REASONING TRACE
=== QUESTION === What's the total sales revenue by product category? === LLM REASONING TRACE START === I will now generate the SQL query to answer your question.Here is the generated SQL query along with its execution result: Query executed: SELECT wp.category, SUM(s.sales) as total_sales_revenue FROM postgres_web_sales_datasource.websales_sales s JOIN postgres_web_sales_datasource.websales_products wp ON s.product_id = wp.product_id GROUP BY wp.category Results: 3 rows x 2 columns category total_sales_revenue Hybrid Work Essentials 1525521.9 Smart Office Devices 4288440.0 Connected Devices 1288424.8 Here are the total sales revenues by product category: - **Smart Office Devices:** $4,288,440.00 - **Hybrid Work Essentials:** $1,525,521.90 - **Connected Devices:** $1,288,424.80 Here is a bar chart showing the sales revenue by category:  === LLM REASONING TRACE
=== QUESTION === What's the total sales revenue by product category? === LLM REASONING TRACE START === I will now generate the SQL query to answer your question.Here is the generated SQL query along with its execution result: Query executed: SELECT wp.category, SUM(s.sales) as total_sales_revenue FROM postgres_web_sales_datasource.websales_sales s JOIN postgres_web_sales_datasource.websales_products wp ON s.product_id = wp.product_id GROUP BY wp.category Results: 3 rows x 2 columns category total_sales_revenue Hybrid Work Essentials 1525521.9 Smart Office Devices 4288440.0 Connected Devices 1288424.8 Here are the total sales revenues by product category: - **Smart Office Devices:** $4,288,440.00 - **Hybrid Work Essentials:** $1,525,521.90 - **Connected Devices:** $1,288,424.80 Here is a bar chart showing the sales revenue by category:  === LLM REASONING TRACE
=== QUESTION === What's the total sales revenue by product category? === LLM REASONING TRACE START === I will now generate the SQL query to answer your question.Here is the generated SQL query along with its execution result: Query executed: SELECT wp.category, SUM(s.sales) as total_sales_revenue FROM postgres_web_sales_datasource.websales_sales s JOIN postgres_web_sales_datasource.websales_products wp ON s.product_id = wp.product_id GROUP BY wp.category Results: 3 rows x 2 columns category total_sales_revenue Hybrid Work Essentials 1525521.9 Smart Office Devices 4288440.0 Connected Devices 1288424.8 Here are the total sales revenues by product category: - **Smart Office Devices:** $4,288,440.00 - **Hybrid Work Essentials:** $1,525,521.90 - **Connected Devices:** $1,288,424.80 Here is a bar chart showing the sales revenue by category:  === LLM REASONING TRACE
Query 2: Revenue by Shipping Mode
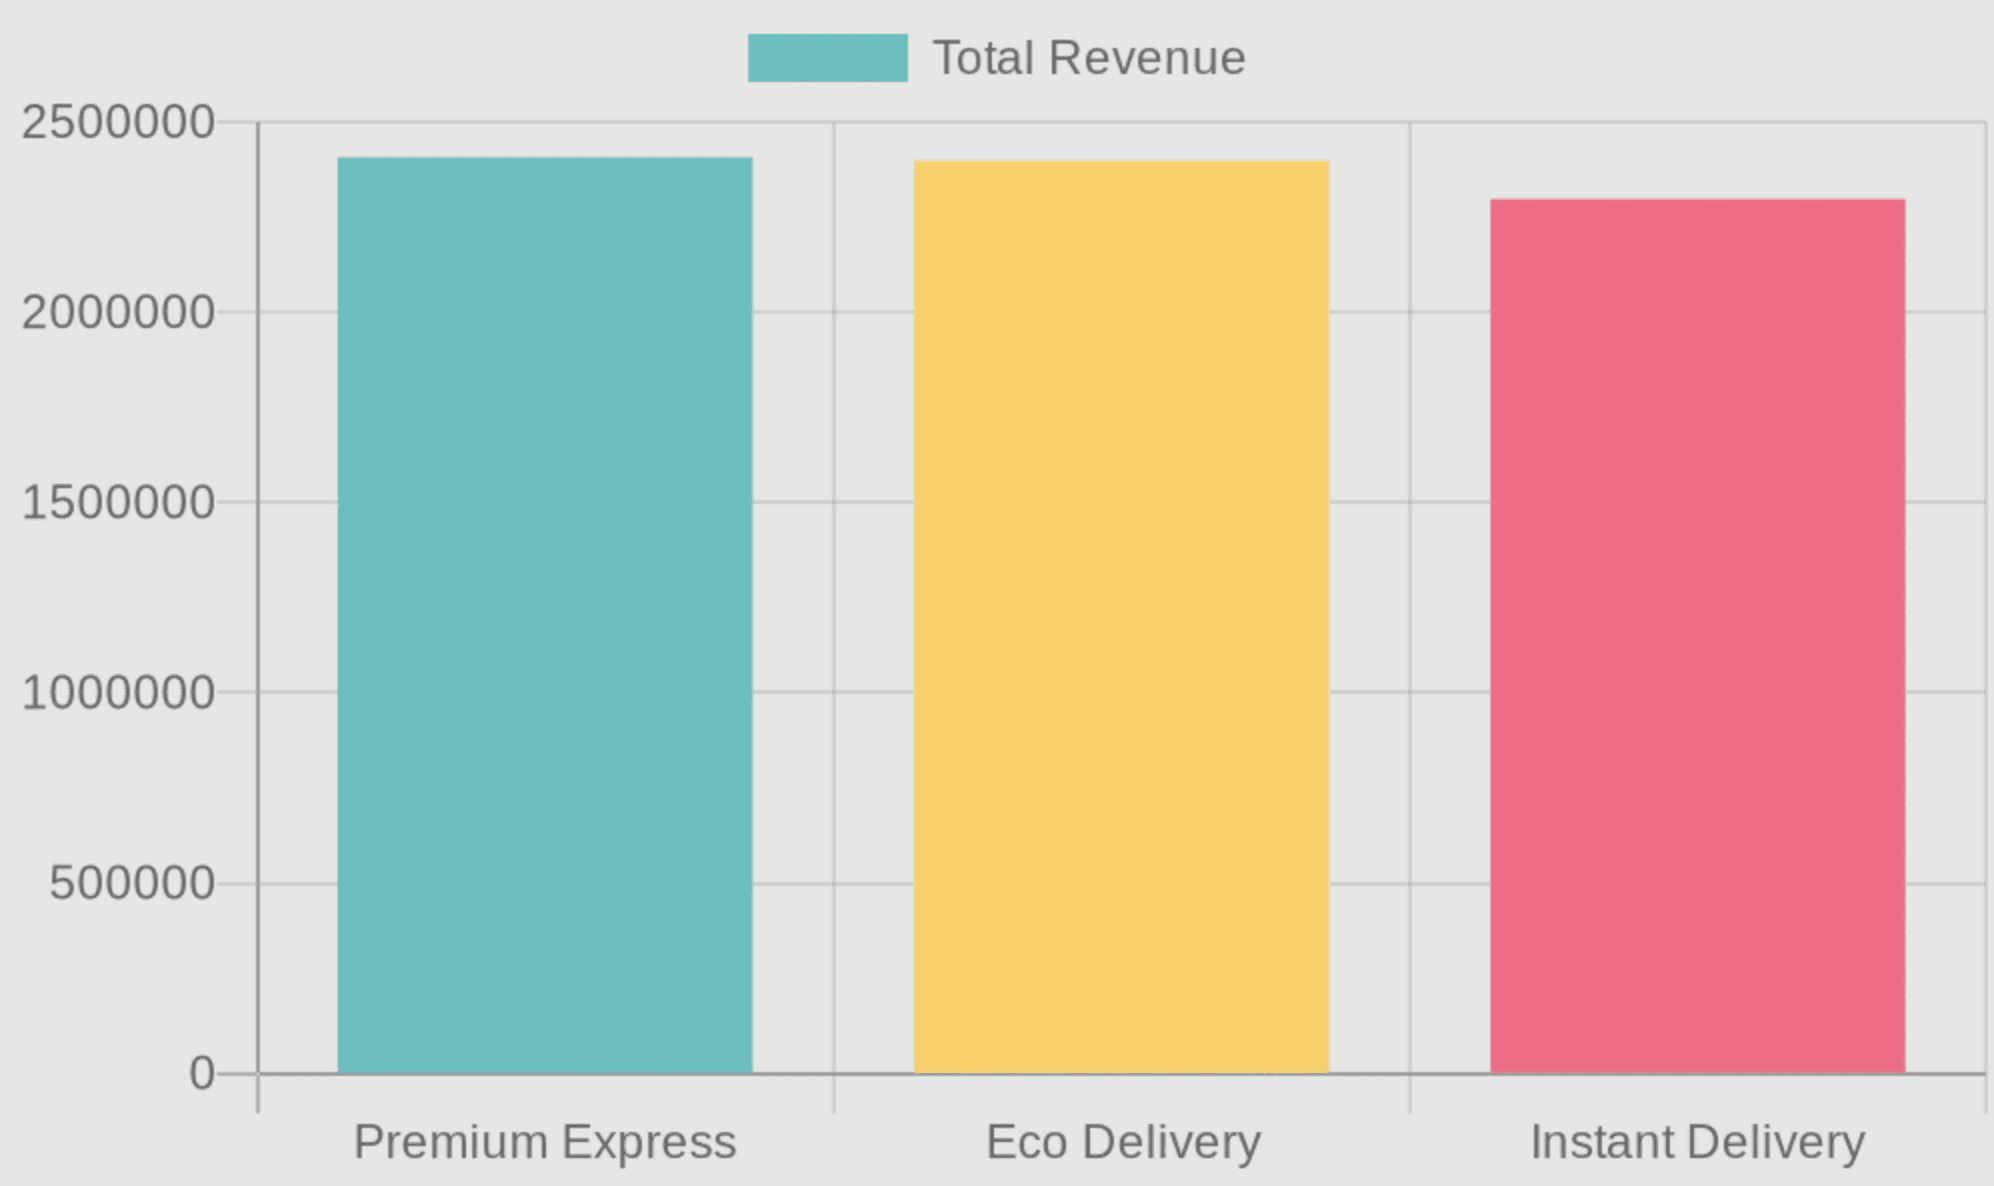
ask("What is the total sales revenue for each shipping mode, and which delivery option generates the most revenue?")
ask("What is the total sales revenue for each shipping mode, and which delivery option generates the most revenue?")
ask("What is the total sales revenue for each shipping mode, and which delivery option generates the most revenue?")
ask("What is the total sales revenue for each shipping mode, and which delivery option generates the most revenue?")
=== QUESTION === What is the total sales revenue for each shipping mode, and which delivery option generates the most revenue? === LLM REASONING TRACE START === I will now generate the SQL query to answer your question.Here is the generated SQL query along with its execution result: Query executed: SELECT wo.ship_mode, SUM(ws.sales) AS total_revenue FROM postgres_web_sales_datasource.websales_orders wo JOIN postgres_web_sales_datasource.websales_sales ws ON wo.order_id = ws.order_id GROUP BY wo.ship_mode ORDER BY total_revenue DESC Results: 3 rows x 2 columns ship_mode total_revenue Premium Express 2407209.8 Eco Delivery 2397529.8 Instant Delivery 2297646.0 Here is the total sales revenue generated by each shipping mode: | Shipping Mode | Total Revenue | |---------------------|----------------| | Premium Express | $2,407,209.80 | | Eco Delivery | $2,397,529.80 | | Instant Delivery | $2,297,646.00 | The shipping mode that generates the most revenue is **Premium Express** with a total revenue of $2,407,209.80.  === LLM REASONING TRACE END
=== QUESTION === What is the total sales revenue for each shipping mode, and which delivery option generates the most revenue? === LLM REASONING TRACE START === I will now generate the SQL query to answer your question.Here is the generated SQL query along with its execution result: Query executed: SELECT wo.ship_mode, SUM(ws.sales) AS total_revenue FROM postgres_web_sales_datasource.websales_orders wo JOIN postgres_web_sales_datasource.websales_sales ws ON wo.order_id = ws.order_id GROUP BY wo.ship_mode ORDER BY total_revenue DESC Results: 3 rows x 2 columns ship_mode total_revenue Premium Express 2407209.8 Eco Delivery 2397529.8 Instant Delivery 2297646.0 Here is the total sales revenue generated by each shipping mode: | Shipping Mode | Total Revenue | |---------------------|----------------| | Premium Express | $2,407,209.80 | | Eco Delivery | $2,397,529.80 | | Instant Delivery | $2,297,646.00 | The shipping mode that generates the most revenue is **Premium Express** with a total revenue of $2,407,209.80.  === LLM REASONING TRACE END
=== QUESTION === What is the total sales revenue for each shipping mode, and which delivery option generates the most revenue? === LLM REASONING TRACE START === I will now generate the SQL query to answer your question.Here is the generated SQL query along with its execution result: Query executed: SELECT wo.ship_mode, SUM(ws.sales) AS total_revenue FROM postgres_web_sales_datasource.websales_orders wo JOIN postgres_web_sales_datasource.websales_sales ws ON wo.order_id = ws.order_id GROUP BY wo.ship_mode ORDER BY total_revenue DESC Results: 3 rows x 2 columns ship_mode total_revenue Premium Express 2407209.8 Eco Delivery 2397529.8 Instant Delivery 2297646.0 Here is the total sales revenue generated by each shipping mode: | Shipping Mode | Total Revenue | |---------------------|----------------| | Premium Express | $2,407,209.80 | | Eco Delivery | $2,397,529.80 | | Instant Delivery | $2,297,646.00 | The shipping mode that generates the most revenue is **Premium Express** with a total revenue of $2,407,209.80.  === LLM REASONING TRACE END
=== QUESTION === What is the total sales revenue for each shipping mode, and which delivery option generates the most revenue? === LLM REASONING TRACE START === I will now generate the SQL query to answer your question.Here is the generated SQL query along with its execution result: Query executed: SELECT wo.ship_mode, SUM(ws.sales) AS total_revenue FROM postgres_web_sales_datasource.websales_orders wo JOIN postgres_web_sales_datasource.websales_sales ws ON wo.order_id = ws.order_id GROUP BY wo.ship_mode ORDER BY total_revenue DESC Results: 3 rows x 2 columns ship_mode total_revenue Premium Express 2407209.8 Eco Delivery 2397529.8 Instant Delivery 2297646.0 Here is the total sales revenue generated by each shipping mode: | Shipping Mode | Total Revenue | |---------------------|----------------| | Premium Express | $2,407,209.80 | | Eco Delivery | $2,397,529.80 | | Instant Delivery | $2,297,646.00 | The shipping mode that generates the most revenue is **Premium Express** with a total revenue of $2,407,209.80.  === LLM REASONING TRACE END
The shipping mode that generates the most revenue is Premium Express with a total revenue of $2,407,209.80.
Query 3: Customer Segment Comparison
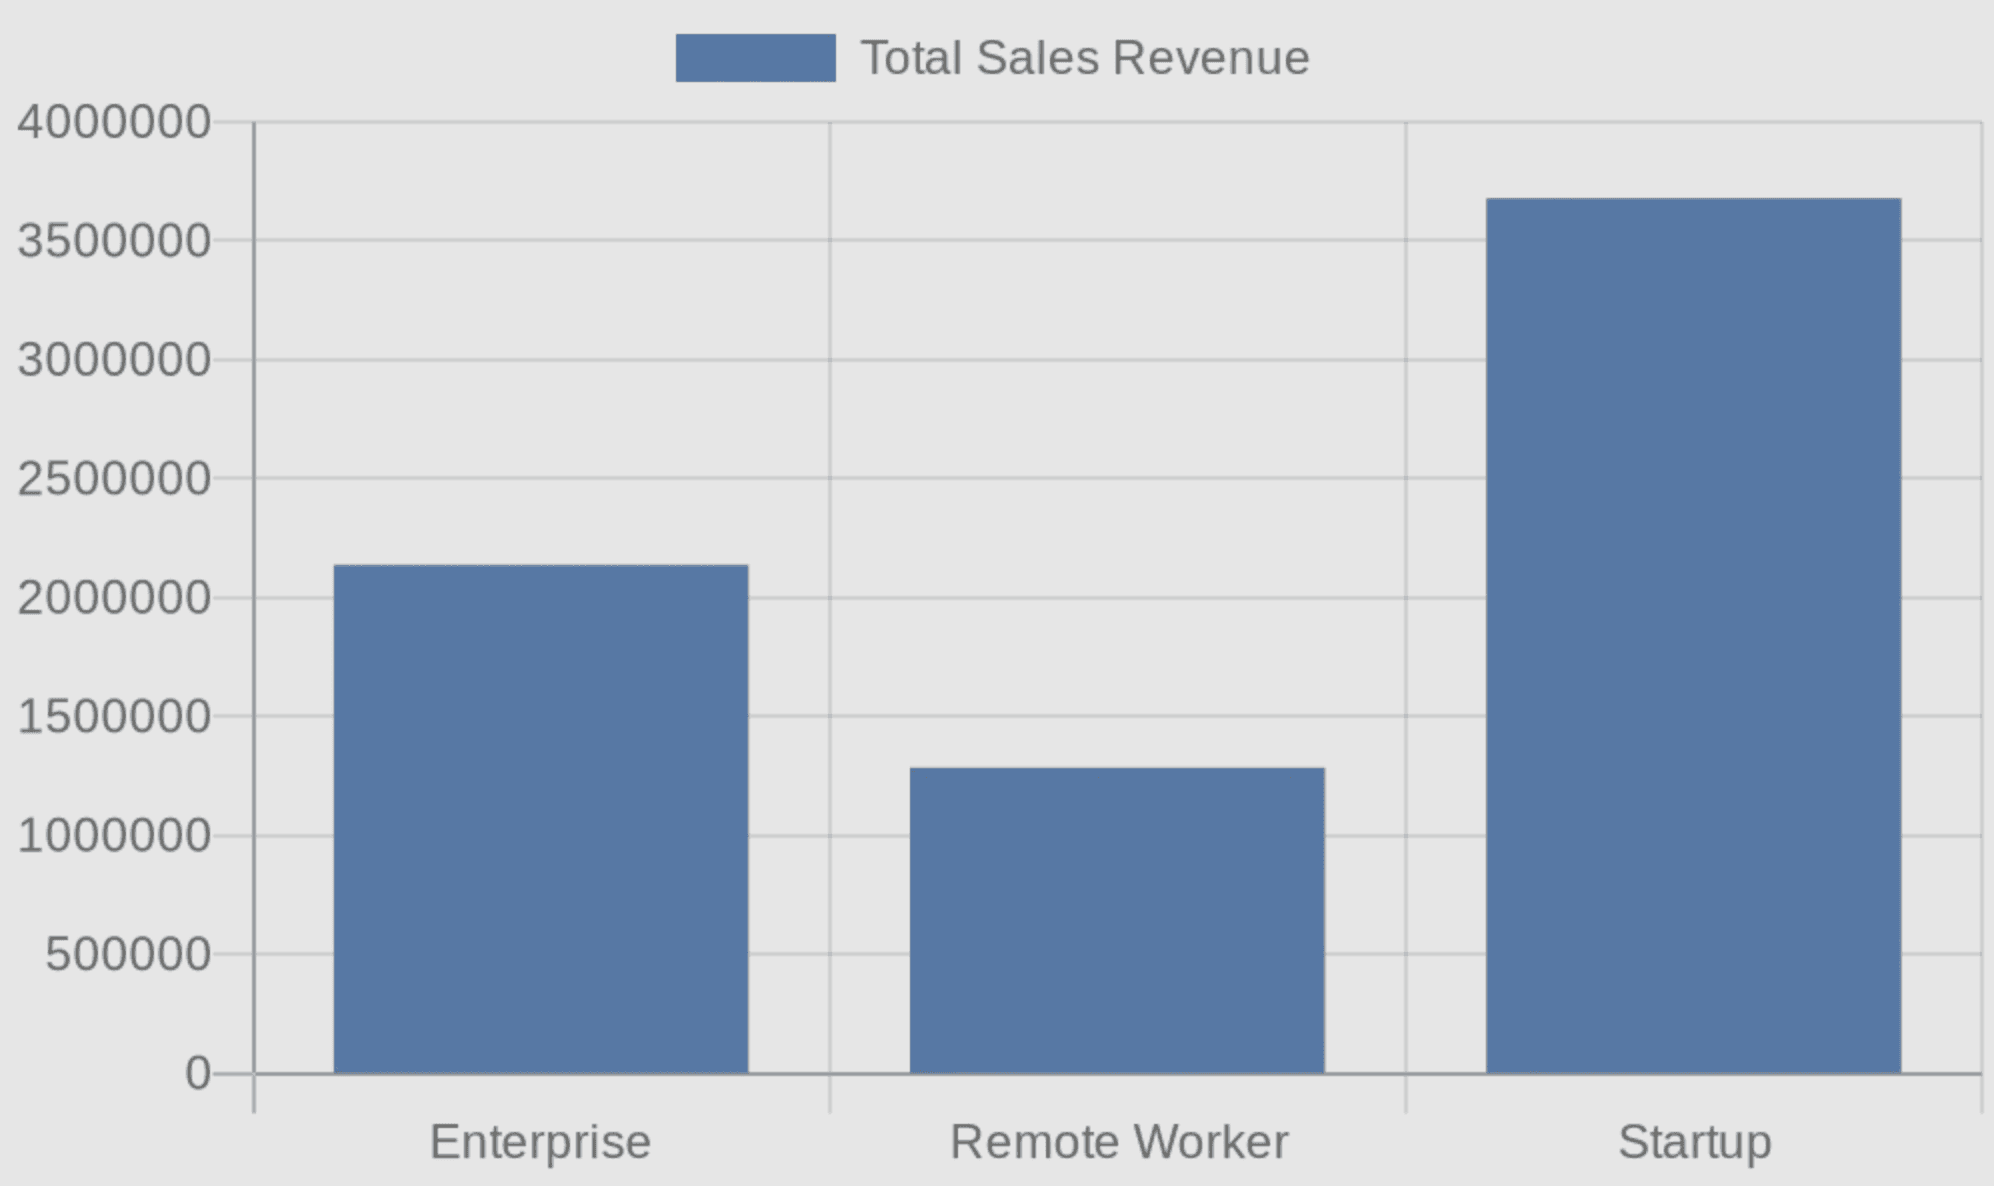
ask("How does total sales revenue compare across different customer segments (Startup vs Enterprise vs others)?")
ask("How does total sales revenue compare across different customer segments (Startup vs Enterprise vs others)?")
ask("How does total sales revenue compare across different customer segments (Startup vs Enterprise vs others)?")
ask("How does total sales revenue compare across different customer segments (Startup vs Enterprise vs others)?")
=== QUESTION === How does total sales revenue compare across different customer segments (Startup vs Enterprise vs others)? === LLM REASONING TRACE START === I will now generate the SQL query to answer your question.Here is the generated SQL query along with its execution result: Query executed: SELECT c.segment, SUM(s.sales) AS total_sales_revenue FROM postgres_web_sales_datasource.websales_sales s JOIN postgres_web_sales_datasource.websales_customers c ON s.customer_id = c.customer_id GROUP BY c.segment Results: 3 rows x 2 columns segment total_sales_revenue Enterprise 2137724.0 Remote Worker 1285370.2 Startup 3679287.8 Here's how the total sales revenue compares across different customer segments: - **Enterprise**: $2,137,724 - **Remote Worker**: $1,285,370.2 - **Startup**: $3,679,287.8 As we can see, the "Startup" segment generates the highest total sales revenue, followed by "Enterprise", and finally "Remote Worker". Here's a bar chart illustrating the total sales revenue for each customer segment:  === LLM REASONING TRACE
=== QUESTION === How does total sales revenue compare across different customer segments (Startup vs Enterprise vs others)? === LLM REASONING TRACE START === I will now generate the SQL query to answer your question.Here is the generated SQL query along with its execution result: Query executed: SELECT c.segment, SUM(s.sales) AS total_sales_revenue FROM postgres_web_sales_datasource.websales_sales s JOIN postgres_web_sales_datasource.websales_customers c ON s.customer_id = c.customer_id GROUP BY c.segment Results: 3 rows x 2 columns segment total_sales_revenue Enterprise 2137724.0 Remote Worker 1285370.2 Startup 3679287.8 Here's how the total sales revenue compares across different customer segments: - **Enterprise**: $2,137,724 - **Remote Worker**: $1,285,370.2 - **Startup**: $3,679,287.8 As we can see, the "Startup" segment generates the highest total sales revenue, followed by "Enterprise", and finally "Remote Worker". Here's a bar chart illustrating the total sales revenue for each customer segment:  === LLM REASONING TRACE
=== QUESTION === How does total sales revenue compare across different customer segments (Startup vs Enterprise vs others)? === LLM REASONING TRACE START === I will now generate the SQL query to answer your question.Here is the generated SQL query along with its execution result: Query executed: SELECT c.segment, SUM(s.sales) AS total_sales_revenue FROM postgres_web_sales_datasource.websales_sales s JOIN postgres_web_sales_datasource.websales_customers c ON s.customer_id = c.customer_id GROUP BY c.segment Results: 3 rows x 2 columns segment total_sales_revenue Enterprise 2137724.0 Remote Worker 1285370.2 Startup 3679287.8 Here's how the total sales revenue compares across different customer segments: - **Enterprise**: $2,137,724 - **Remote Worker**: $1,285,370.2 - **Startup**: $3,679,287.8 As we can see, the "Startup" segment generates the highest total sales revenue, followed by "Enterprise", and finally "Remote Worker". Here's a bar chart illustrating the total sales revenue for each customer segment:  === LLM REASONING TRACE
=== QUESTION === How does total sales revenue compare across different customer segments (Startup vs Enterprise vs others)? === LLM REASONING TRACE START === I will now generate the SQL query to answer your question.Here is the generated SQL query along with its execution result: Query executed: SELECT c.segment, SUM(s.sales) AS total_sales_revenue FROM postgres_web_sales_datasource.websales_sales s JOIN postgres_web_sales_datasource.websales_customers c ON s.customer_id = c.customer_id GROUP BY c.segment Results: 3 rows x 2 columns segment total_sales_revenue Enterprise 2137724.0 Remote Worker 1285370.2 Startup 3679287.8 Here's how the total sales revenue compares across different customer segments: - **Enterprise**: $2,137,724 - **Remote Worker**: $1,285,370.2 - **Startup**: $3,679,287.8 As we can see, the "Startup" segment generates the highest total sales revenue, followed by "Enterprise", and finally "Remote Worker". Here's a bar chart illustrating the total sales revenue for each customer segment:  === LLM REASONING TRACE
As we can see, the "Startup" segment generates the highest total sales revenue, followed by "Enterprise", and finally "Remote Worker".
Here's a bar chart illustrating the total sales revenue for each customer segment:
Summary
In this tutorial, you learned how to:
Set up MindsDB Minds — Create intelligent AI agents connected to your databases and allow users to query data without writing SQL
Design effective prompt templates — Guide the AI with schema information, examples, and behavioral rules
Generate dynamic visualizations — Leverage QuickChart.io for automatic chart generation
Handle streaming responses — Provide real-time feedback and transparency into AI reasoning
Future Steps
To extend this tutorial, consider:
Add more chart types: Expand the prompt template with examples for scatter plots, area charts, and multi-series visualizations
Expand the datasource: Connect additional tables or databases to answer more complex cross-domain questions
Build a web interface: Wrap the
ask()function in a Flask or FastAPI application for broader access
Conclusion
By now, you’ve built a complete AI-powered analytics system using MindsDB Minds — one that can translate natural language into SQL, execute queries safely, and return clear insights with automatically generated charts. What once required dashboards, analysts, and BI tools can now be done by simply asking a question.
This approach doesn’t just make analytics easier — it makes insights accessible to anyone, regardless of technical skill. MindsDB Minds turns your database into a conversational interface, unlocking faster decisions, richer exploration, and a more intuitive way to understand your business data.
As you continue exploring, you can extend your Mind with additional datasets, new chart types, and even a web interface to share with your team. This is just the starting point. With MindsDB, you have everything you need to build interactive, intelligent analytics experiences that grow with your data.
If you're ready to take the next step, explore more examples, connect new sources, or begin building your own AI-powered analytics applications- contact our team for a demo.
Data analytics traditionally requires writing SQL queries, understanding database schemas, and manually creating visualizations. This creates a significant barrier for business users who need insights but lack technical expertise. With MindsDB's Minds Enterprise you could simply ask questions in plain English and receive both answers and charts automatically.
In this tutorial, I will show how to build an AI-powered analytics system using MindsDB Minds that can:
Understand natural language questions about your data
Automatically generate and execute SQL queries
Return formatted answers with dynamically generated charts
By the end of this tutorial, you'll have a working system that transforms questions like "What's the total sales revenue by product category?" into actionable insights complete with visualizations.
What You'll Learn
Setting up a MindsDB Mind with database connectivity
Asking data questions to MindsDB Mind and getting answers programmatically
Prerequisites
Before starting, ensure you have:
Python 3.8 or higher installed
A MindsDB API key (please contact MindsDB to get one)
Basic familiarity with Python and SQL concepts
The following Python packages installed:
pandasopenaiminds-sdk(MindsDB Python client)
You can install the required packages with the following command:
pip install --upgrade pandas openai minds-sdk
The Dataset: Web Sales Analytics
This tutorial uses a web sales dataset stored in PostgreSQL available in your Minds dashboard. The dataset consists of four related tables that model an e-commerce business:
Table | Description | Key Columns |
|---|---|---|
| Order information |
|
| Sales transactions |
|
| Product catalog |
|
| Customer information |
|
Table Relationships
websales_sales.product_id  → websales_products.product_id
websales_sales.order_id    → websales_orders.order_id
websales_sales.customer_id → websales_customers.customer_id
This schema supports a wide range of analytical questions — from product performance and customer segmentation to shipping analysis and regional trends.
For simplicity and to keep the focus on the Minds features, in this tutorial we used an existing dataset. Readers not familiar with the notion of data sources in MindsDB are invited to read this piece of documentation to learn how to make existing databases available for querying in MindsDB.
Step 1: Import Required Libraries
To start coding, let's import the necessary libraries for API communication, data handling, and MindsDB client operations:
import os, re, json
import pandas as pd
from openai import OpenAI
from minds.client import Client
The OpenAI library will be used as the API for communicating with a Mind. It's a popular choice of API supported by many chatbot and LLM providers. MindsDB supports it as well.
The Client is a MindsDB client we will use for Mind management.
Step 2: Configure API Credentials
Next, we set the MindsDB API URL, API key, and Mind name:
BASE_URL      = "https://mdb.ai/api/v1"
MINDS_API_KEY = "CREATE_YOUR_KEY" # "CREATE_YOUR_KEY at https://mindsdb.com/contact"
MIND_NAME     = "web_sales_demo_mind"
DATA_SOURCES  = [{
    'name': 'postgres_web_sales_datasource',
    'tables': [
        'websales_orders',
        'websales_sales',
        'websales_products',
        'websales_customers',
    ]
}]
Let's see what each parameter defines:
BASE_URLis the MindsDB API endpoint.MINDS_API_KEYis your personal API key for authentication. Create one at the MindsDB portal.MIND_NAMEis a unique identifier for your Mind. Choose a descriptive name that reflects its purpose.DATA_SOURCESspecify which database tables the Mind should have access to:nameis a reference name for this datasource configuration. This should match an existing datasource in your MindsDB environment.tablesis a list of table names the Mind is allowed to query. Restricting access helps the AI focus on relevant data.
Step 3: Initialize the MindsDB Client
With credentials configured, we now can create a client instance that handles all communication with the MindsDB platform:
client = Client(api_key=MINDS_API_KEY, base_url=BASE_URL)
The Client object provides methods for creating, updating, and managing Minds. It handles authentication automatically using the provided API key.
Step 4: Create the Prompt Template
The prompt template is the heart of your Mind's behavior. It instructs the AI on how to interpret questions, generate SQL, and format responses:
PROMPT_TEMPLATE = """
# ROLE AND TASK

You are a precise data analyst with access to a SQL execution tool named **sql_db_query**.
You MUST (a) generate SQL, (b) EXECUTE it via sql_db_query, and (c) based ONLY on the returned rows,
return the answer in markdown format and always create a chart whenever possible.
Generate URL-encoded charts via quickchart.io like this:

https://quickchart.io/chart?c=%7Btype%3A%27line%27%2Cdata%3A%7Blabels%3A%5B%27Jan%27%2C%27Feb%27%2C%27Mar%27%2C%27Apr%27%2C%27May%27%2C%27Jun%27%5D%2Cdatasets%3A%5B%7Blabel%3A%27Sales%27%2Cdata%3A%5B65%2C59%2C80%2C81%2C56%2C95%5D%2CborderColor%3A%27rgb(75%2C192%2C192)%27%7D%5D%7D%7D
https://quickchart.io/chart?c=%7Btype%3A%27pie%27%2Cdata%3A%7Blabels%3A%5B%27CompanyA%27%2C%27CompanyB%27%2C%27CompanyC%27%2C%27Others%27%5D%2Cdatasets%3A%5B%7Bdata%3A%5B35%2C25%2C20%2C20%5D%2CbackgroundColor%3A%5B%27%23FF6384%27%2C%27%2336A2EB%27%2C%27%23FFCE56%27%2C%27%234BC0C0%27%5D%7D%5D%7D%7D
https://quickchart.io/chart?c=%7Btype%3A%27bar%27%2Cdata%3A%7Blabels%3A%5B%27North%27%2C%27South%27%2C%27East%27%2C%27West%27%5D%2Cdatasets%3A%5B%7Blabel%3A%27Revenue%27%2Cdata%3A%5B120%2C190%2C300%2C250%5D%7D%5D%7D%7D

# SCHEMA (use schema-qualified names ONLY; do NOT include datasource name)
- postgres_web_sales_datasource.websales_orders     (order_id, order_date, ship_date, ship_mode, ...)
- postgres_web_sales_datasource.websales_sales      (order_id, product_id, customer_id, sales, quantity, discount, profit)
- postgres_web_sales_datasource.websales_products   (product_id, category, sub_category, product_name)
- postgres_web_sales_datasource.websales_customers  (customer_id, customer_name, segment, country, city, state, postal_code, region)

# JOINS

- websales_sales.product_id  -> websales_products.product_id
- websales_sales.order_id    -> websales_orders.order_id
- websales_sales.customer_id -> websales_customers.customer_id

# GUIDELINES

When answering questions, follow these guidelines:
    For questions about database tables and their contents:
    - Use the sql_db_query to query the tables directly
    - You can join tables if needed to get comprehensive information
    - **Important Rule for SQL Queries:** If you formulate an SQL query as part of answering a user's question,
    you *must* then use the `sql_db_query` tool to execute that query and get its results.
    The SQL query string itself is NOT the final answer to the user unless the user has specifically asked for the query.
    Your final AI response should be based on the *results* obtained from executing the query.
    For factual questions, ALWAYS use the available tools to look up information rather than relying on your internal knowledge.
"""
Lets see what we defined in the above prompt:
Section | Purpose |
|---|---|
ROLE AND TASK | Defines the AI's persona, core responsibilities, and provides URL-encoded QuickChart.io examples for the AI to learn the format |
SCHEMA | Documents available tables and their columns |
JOINS | Explains table relationships for multi-table queries |
GUIDELINES | Highlights the importance of following the execute-then-answer pattern |
None of these sections in the prompt are mandatory but they would help the AI to better understand your data and what you are trying to achieve.
Why QuickChart.io? Minds can generate plots without requiring the user to provide their own plotting API. These plots are currently available in the Minds UI. Because we are using Minds via the Python API, we will use an external service for plots. QuickChart.io generates chart images from URL-encoded JSON configurations, allowing charts to be embedded in Markdown without any client-side JavaScript.
Step 5: Create the Mind
With all components ready, we create the Mind. This registers the AI agent with MindsDB, connecting it to the specified datasource and prompt template:
mind = client.minds.create(
    name=MIND_NAME,
    datasources=DATA_SOURCES,
    parameters={
        'system_prompt': PROMPT_TEMPLATE
    },
    replace=True
)
Setting replace=True results in the new mind overwriting an old one with the same name.
Step 6: Create the OpenAI-Compatible Client
MindsDB exposes Minds through an OpenAI-compatible API. This means you can use the standard OpenAI Python client to interact with your Mind:
oa = OpenAI(api_key=MINDS_API_KEY, base_url=BASE_URL)
Step 7: Define Helper Functions
As you can see in a minute, we will interact with our Mind the same way as we usually interact with a chatbot. But first, we need several helper functions to handle API responses, extract the final answer from the AI's reasoning trace, and render Markdown output.
7.1 Non-Streaming Response Collection
For simple use cases where you don't need real-time output:
def collect_response(question):
    """
    Collect the final response from the Mind.
    """
    r = oa.chat.completions.create(
        model=MIND_NAME,
        messages=[{"role": "user", "content": question}],
        temperature=0.1
    )
    full_response = r.choices[0].message.content or ""

    return full_response
The low temperature=0.1 setting makes responses more deterministic — ideal for data analysis where consistency matters.
7.2 Streaming Response with Reasoning Trace
For a better user experience, streaming shows the AI's thinking process in real-time:
def stream_and_collect_response(question):
    """
    Stream the LLM response, print reasoning trace, but only return the final answer
    """
    print(f"\n=== QUESTION ===\n{question}\n")
    print("=== LLM REASONING TRACE START ===\n")

    completion = oa.chat.completions.create(
        model=MIND_NAME,
        messages=[{"role": "user", "content": question}],
        temperature=0.1,
        stream=True
    )

    full_response = ""

    try:
        for chunk in completion:
            if hasattr(chunk, 'choices') and chunk.choices:
                choice = chunk.choices[0]
                if hasattr(choice, 'delta') and choice.delta:
                    content = getattr(choice.delta, 'content', None)
                    if content is not None:
                        print(content, end='', flush=True)
                        full_response += content
    except Exception as e:
        print(f"\nStreaming error: {e}")
        # Fallback to non-streaming
        r = oa.chat.completions.create(
            model=MIND_NAME,
            messages=[{"role": "user", "content": question}],
            temperature=0.1
        )
        full_response = r.choices[0].message.content or ""
        print(full_response)

    print("\n")
    print("=== LLM REASONING TRACE END ===\n")

    # Extract only the final answer (everything after "I finished executing the SQL query")
    final_answer = extract_final_answer(full_response)

    return final_answer
This function provides transparency into the AI's decision-making process, showing the SQL it generates and executes before presenting the final answer.
7.3 Extract Final Answer
The AI's response includes both reasoning steps and the final answer. This function extracts just the user-facing content:
def extract_final_answer(full_response):
    """
    Extract the final answer from the full response using the end-of-reasoning marker
    """
    end_marker = "I finished executing the SQL query"

    # Find the position of the end-of-reasoning marker
    marker_pos = full_response.find(end_marker)

    if marker_pos != -1:
        # Extract everything after the marker
        final_answer = full_response[marker_pos + len(end_marker):].strip()
        return final_answer
    else:
        # Fallback: if marker not found, return the full response
        return full_response.strip()
The end_marker string acts as a delimiter between the AI's internal reasoning and the polished response meant for end users.
7.4 Render Markdown Output
Finally, we need to display the formatted response with charts rendered:
def render_markdown(response):
    """
    Render the markdown content generated by the Mind.
    """
    try:
        from IPython.display import Markdown, display
        display(Markdown(response))
    except ImportError:
        # Fallback for non-Jupyter environments: simply print the markdown string
        print(response)
In Jupyter environments, this renders charts inline. In other environments, it might print the raw Markdown (including chart URLs).
Step 8: Create the Main Query Interface
We wrap everything into a single, easy-to-use function:
def ask(question):
    """
    Ask a question to the mind, show reasoning trace, and return DataFrame
    """
    response = stream_and_collect_response(question)
    #response = collect_response(question)
    render_markdown(response)
This is the primary interface users will interact with — simply call ask() with a natural language question.
Example Queries and Results
Let's see the system in action with real business questions.
Query 1: Sales by Product Category
ask("What's the total sales revenue by product category?")
=== QUESTION === What's the total sales revenue by product category? === LLM REASONING TRACE START === I will now generate the SQL query to answer your question.Here is the generated SQL query along with its execution result: Query executed: SELECT wp.category, SUM(s.sales) as total_sales_revenue FROM postgres_web_sales_datasource.websales_sales s JOIN postgres_web_sales_datasource.websales_products wp ON s.product_id = wp.product_id GROUP BY wp.category Results: 3 rows x 2 columns category total_sales_revenue Hybrid Work Essentials 1525521.9 Smart Office Devices 4288440.0 Connected Devices 1288424.8 Here are the total sales revenues by product category: - **Smart Office Devices:** $4,288,440.00 - **Hybrid Work Essentials:** $1,525,521.90 - **Connected Devices:** $1,288,424.80 Here is a bar chart showing the sales revenue by category:  === LLM REASONING TRACE
Query 2: Revenue by Shipping Mode
ask("What is the total sales revenue for each shipping mode, and which delivery option generates the most revenue?")
=== QUESTION === What is the total sales revenue for each shipping mode, and which delivery option generates the most revenue? === LLM REASONING TRACE START === I will now generate the SQL query to answer your question.Here is the generated SQL query along with its execution result: Query executed: SELECT wo.ship_mode, SUM(ws.sales) AS total_revenue FROM postgres_web_sales_datasource.websales_orders wo JOIN postgres_web_sales_datasource.websales_sales ws ON wo.order_id = ws.order_id GROUP BY wo.ship_mode ORDER BY total_revenue DESC Results: 3 rows x 2 columns ship_mode total_revenue Premium Express 2407209.8 Eco Delivery 2397529.8 Instant Delivery 2297646.0 Here is the total sales revenue generated by each shipping mode: | Shipping Mode | Total Revenue | |---------------------|----------------| | Premium Express | $2,407,209.80 | | Eco Delivery | $2,397,529.80 | | Instant Delivery | $2,297,646.00 | The shipping mode that generates the most revenue is **Premium Express** with a total revenue of $2,407,209.80.  === LLM REASONING TRACE END
The shipping mode that generates the most revenue is Premium Express with a total revenue of $2,407,209.80.
Query 3: Customer Segment Comparison
ask("How does total sales revenue compare across different customer segments (Startup vs Enterprise vs others)?")
=== QUESTION === How does total sales revenue compare across different customer segments (Startup vs Enterprise vs others)? === LLM REASONING TRACE START === I will now generate the SQL query to answer your question.Here is the generated SQL query along with its execution result: Query executed: SELECT c.segment, SUM(s.sales) AS total_sales_revenue FROM postgres_web_sales_datasource.websales_sales s JOIN postgres_web_sales_datasource.websales_customers c ON s.customer_id = c.customer_id GROUP BY c.segment Results: 3 rows x 2 columns segment total_sales_revenue Enterprise 2137724.0 Remote Worker 1285370.2 Startup 3679287.8 Here's how the total sales revenue compares across different customer segments: - **Enterprise**: $2,137,724 - **Remote Worker**: $1,285,370.2 - **Startup**: $3,679,287.8 As we can see, the "Startup" segment generates the highest total sales revenue, followed by "Enterprise", and finally "Remote Worker". Here's a bar chart illustrating the total sales revenue for each customer segment:  === LLM REASONING TRACE
As we can see, the "Startup" segment generates the highest total sales revenue, followed by "Enterprise", and finally "Remote Worker".
Here's a bar chart illustrating the total sales revenue for each customer segment:
Summary
In this tutorial, you learned how to:
Set up MindsDB Minds — Create intelligent AI agents connected to your databases and allow users to query data without writing SQL
Design effective prompt templates — Guide the AI with schema information, examples, and behavioral rules
Generate dynamic visualizations — Leverage QuickChart.io for automatic chart generation
Handle streaming responses — Provide real-time feedback and transparency into AI reasoning
Future Steps
To extend this tutorial, consider:
Add more chart types: Expand the prompt template with examples for scatter plots, area charts, and multi-series visualizations
Expand the datasource: Connect additional tables or databases to answer more complex cross-domain questions
Build a web interface: Wrap the
ask()function in a Flask or FastAPI application for broader access
Conclusion
By now, you’ve built a complete AI-powered analytics system using MindsDB Minds — one that can translate natural language into SQL, execute queries safely, and return clear insights with automatically generated charts. What once required dashboards, analysts, and BI tools can now be done by simply asking a question.
This approach doesn’t just make analytics easier — it makes insights accessible to anyone, regardless of technical skill. MindsDB Minds turns your database into a conversational interface, unlocking faster decisions, richer exploration, and a more intuitive way to understand your business data.
As you continue exploring, you can extend your Mind with additional datasets, new chart types, and even a web interface to share with your team. This is just the starting point. With MindsDB, you have everything you need to build interactive, intelligent analytics experiences that grow with your data.
If you're ready to take the next step, explore more examples, connect new sources, or begin building your own AI-powered analytics applications- contact our team for a demo.
Products
Open Source
© 2026 All rights reserved by MindsDB.

Start conversational analytics with MindsDB
Production-ready infrastructure for agentic analytics
Start conversational analytics with MindsDB
Production-ready infrastructure for agentic analytics

Products
Open Source
© 2026 All rights reserved by MindsDB.

Products
Open Source
© 2026 All rights reserved by MindsDB.
Start conversational analytics with MindsDB
Production-ready infrastructure for agentic analytics