Building a Chrome Extension with Anton - From Prompt to Production

Sebastian Tobon, Senior Front End Engineer at MindsDB

What do most people think “AI coding” is? Basically smarter autocomplete.
That assumption doesn’t last long.
I built Anton Scraper v2.0 with Anton—an autonomous agent system built on top of Claude—and quickly realized this is something different.
This wasn’t line-by-line pair programming. This was closer to handing a scoped project to a technical teammate who can plan, execute, debug, and keep context from previous sessions.
In one run, Anton helped me ship a Chrome extension that:
Extracts structured data from any page
Stores scrape history
And generates a full interactive dashboard with one click
Why This Was Built
Most data workflows are still unnecessarily manual.
You find a page → copy data → clean it → load it into a tool → build charts → share results. It’s fragmented, slow, and repetitive. The goal here was simple: collapse that entire workflow into one flow.
From “I found something interesting on a page”
To “I have structured data and a usable dashboard”
…in minutes, not hours.
This project was also a way to test a bigger idea:
“Can an autonomous agent actually build and ship a usable product—not just assist with code?”
A quick summary on what happened and what you can expect:
The build took approximately 40 minutes from end to end.
The user experience follows a simple flow: scrape data, review history, adjust settings, and generate a dashboard with one click.
The system uses a split model approach, with Claude Haiku handling data extraction and Claude Opus responsible for dashboard generation.
Dashboard generation typically takes between 8 to 12 seconds after scraping is complete.
The biggest advantage was the speed of implementation.
The main risk is that the local server setup and API key handling still need to be hardened.
The Starting Point: Accessing Anton and Building the Chrome Extension
MindsDB Anton can be accessed by following the steps on Anton’s Github repository.
Onboarding:
Spin up Anton locally in one command and you’re ready to go:
On MacOS/Linux:
curl -sSf https://raw.githubusercontent.com/mindsdb/anton/main/install.sh | sh && export PATH="$HOME/.local/bin:$PATH"
curl -sSf https://raw.githubusercontent.com/mindsdb/anton/main/install.sh | sh && export PATH="$HOME/.local/bin:$PATH"
curl -sSf https://raw.githubusercontent.com/mindsdb/anton/main/install.sh | sh && export PATH="$HOME/.local/bin:$PATH"
curl -sSf https://raw.githubusercontent.com/mindsdb/anton/main/install.sh | sh && export PATH="$HOME/.local/bin:$PATH"
Anton is also available as a Desktop App on Mac, you can download it here.
Or Windows:
irm https://raw.githubusercontent.com/mindsdb/anton/main/install.ps1 | iex
irm https://raw.githubusercontent.com/mindsdb/anton/main/install.ps1 | iex
irm https://raw.githubusercontent.com/mindsdb/anton/main/install.ps1 | iex
irm https://raw.githubusercontent.com/mindsdb/anton/main/install.ps1 | iex
Once it is installed, you can run the following command to start Anton:
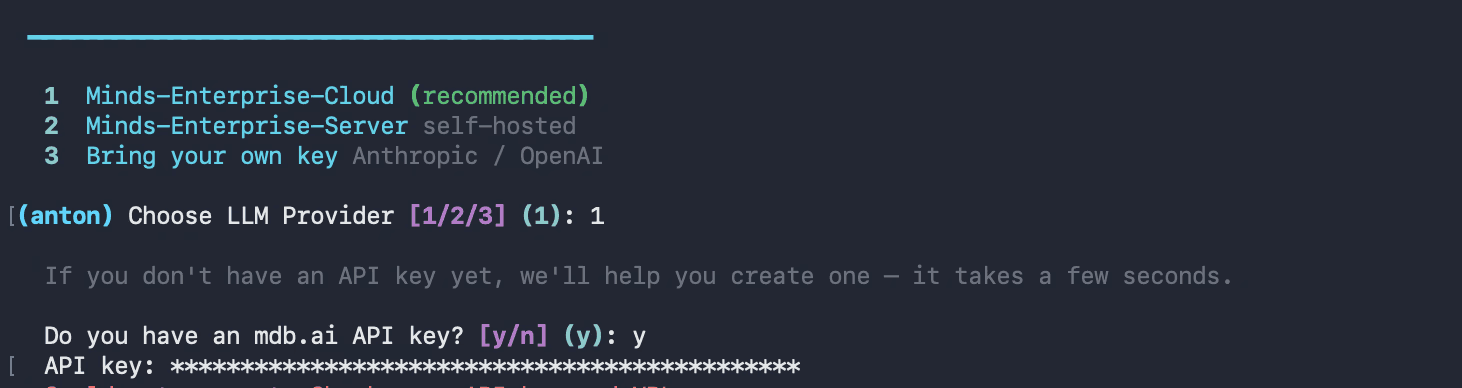
antonantonantonantonOn Anton’s start up screen, you will be prompted to choose an LLM Provider that will basically power everything.
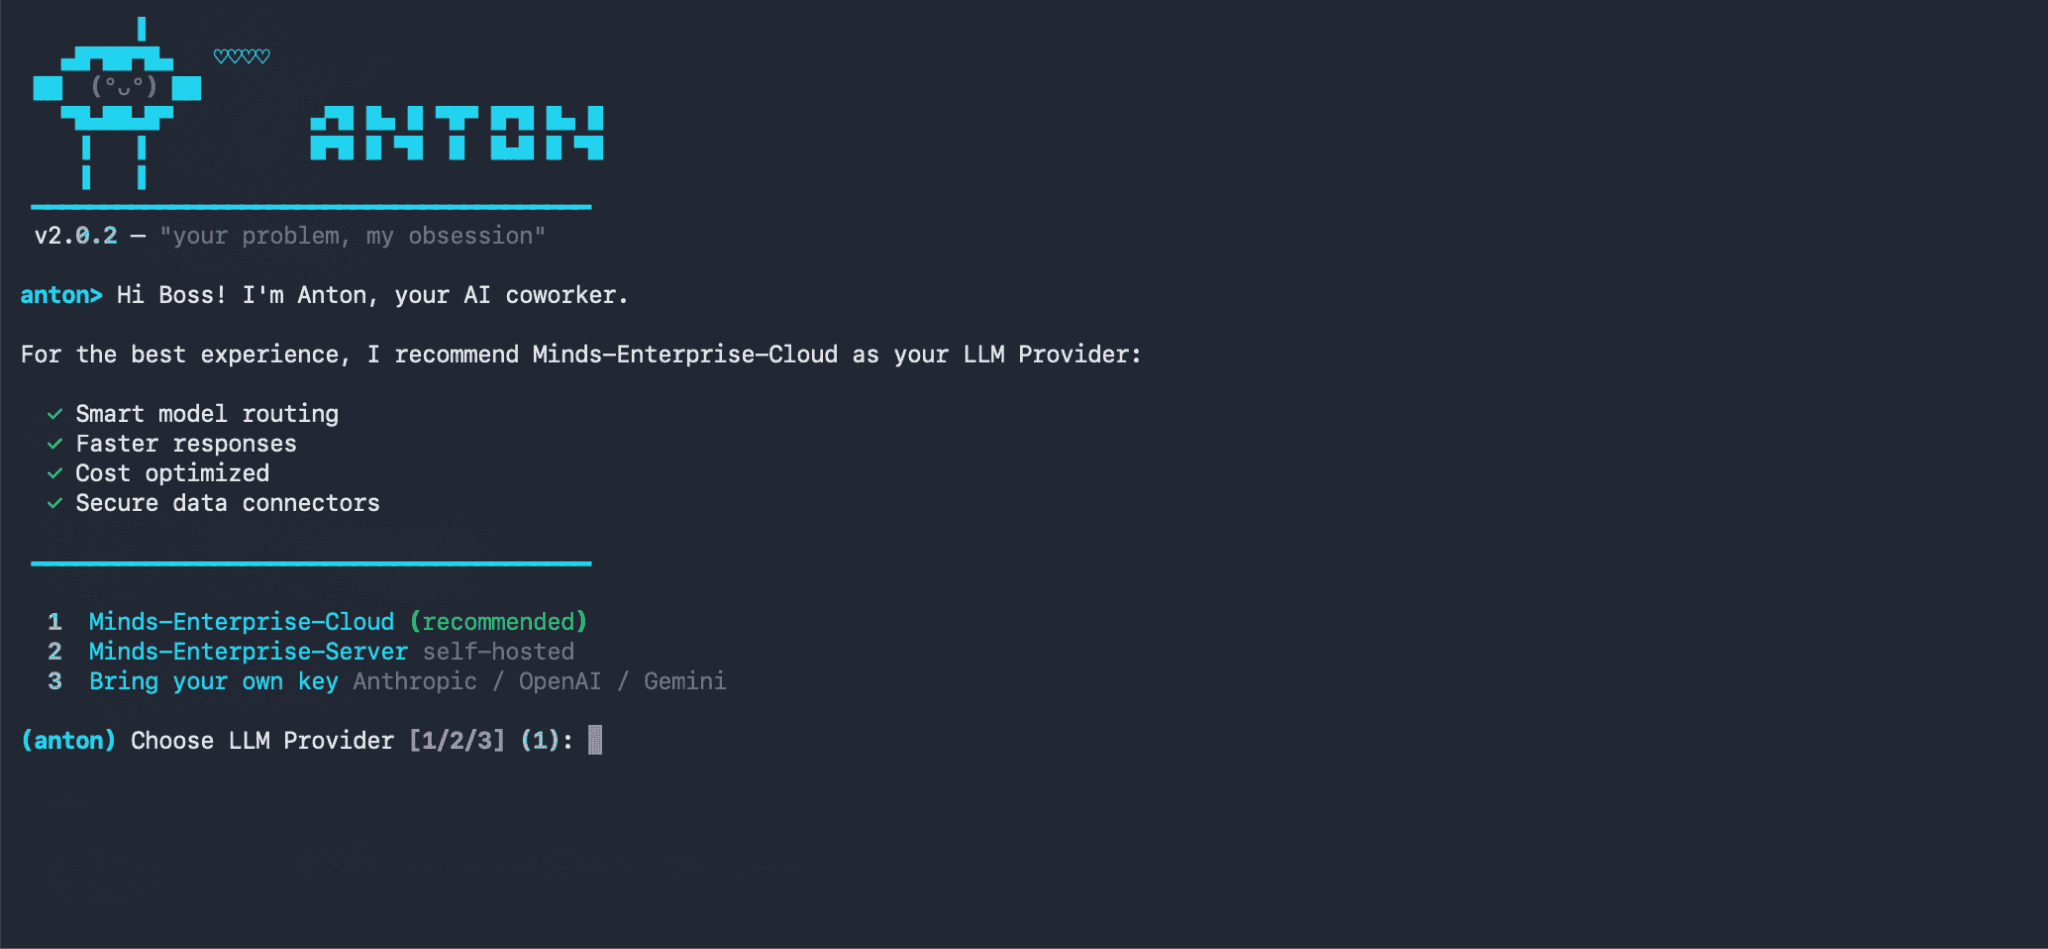
Here we are choosing the 1st option- Minds-Enterprise-Cloud. This will give you access to various LLMs supported by Minds.
Once you have been onboarded with your LLM provider, you can go ahead and prompt Anton to build the Chrome extension.
Version 1 was already there. Anton had built a rough v1 in a previous session-functional, but not something you’d want to show anyone.
For v2, I asked for two things:
Refine the UI so it feels like a real product, not a prototype
Add dashboard generation-turn the scraped data into something visual
Here is the prompt provided to Anton to build the extension:
Chrome Extension

Manifest & Permissions:

 • Manifest v2, permissions: activeTab, scripting, storage, downloads, tabs
 • Host permissions for <all_urls>
 • Popup, background service worker, and content scripts injected on all URLs

Popup UI (popup.html):

 • Dark GitHub-style theme (#0d1117), 460px wide
 • Header with logo, a live status dot (green = local server online, red = offline), and a chip showing the current page URL
 • Three tabs: Scrape, History, Settings
 • Scrape tab:
    • Anthropic API key input + Save button (persisted in chrome.storage.local)
    • Model selector dropdown with fast / balanced / smart tiers (mapping to Claude Haiku, Sonnet, Opus)
    • "Scrape This Page" button with purple-to-blue gradient
    • Status bar with loading spinner
    • Results table with schema chips showing auto-detected fields, column filters
    • Download bar with JSON and CSV export
    • "Dashboard " button that sends scraped data to a local server to generate an ECharts dashboard
 • History tab: list of previous scrapes with one-click reload
 • Settings tab: toggles like autoHistory (default on)

Content Script (content.js):

 • Listen for GET_PAGE_CONTENT from the popup
 • Clone <body>, strip <script>, <style>, <nav>, <footer>, <iframe>, <noscript>, <header>
 • Return cleaned text truncated to 12,000 characters

Background (background.js):

 • On install, set autoHistory: true in chrome.storage.local

Popup Logic (popup.js):

 • On scrape: get cleaned page text → send to Claude API → display structured JSON in the results table → auto-save to history
 • Dashboard button: POST data + URL + title + API key to http://localhost:7842/generate-dashboard → open the returned file:// URI in a new tab

----------------------------------------------------------------------------------

Local Python Server (server/anton_server.py)

Flask + flask-cors on port 7842:

 • GET /ping — health check (drives the green/red dot in the extension)
 • POST /generate-dashboard — accepts { data[
Before writing a single line of code, Anton paused and pushed for an architecture decision
The Architecture Decision
Anton proposed two options:
Option A: keep everything inside the extension.
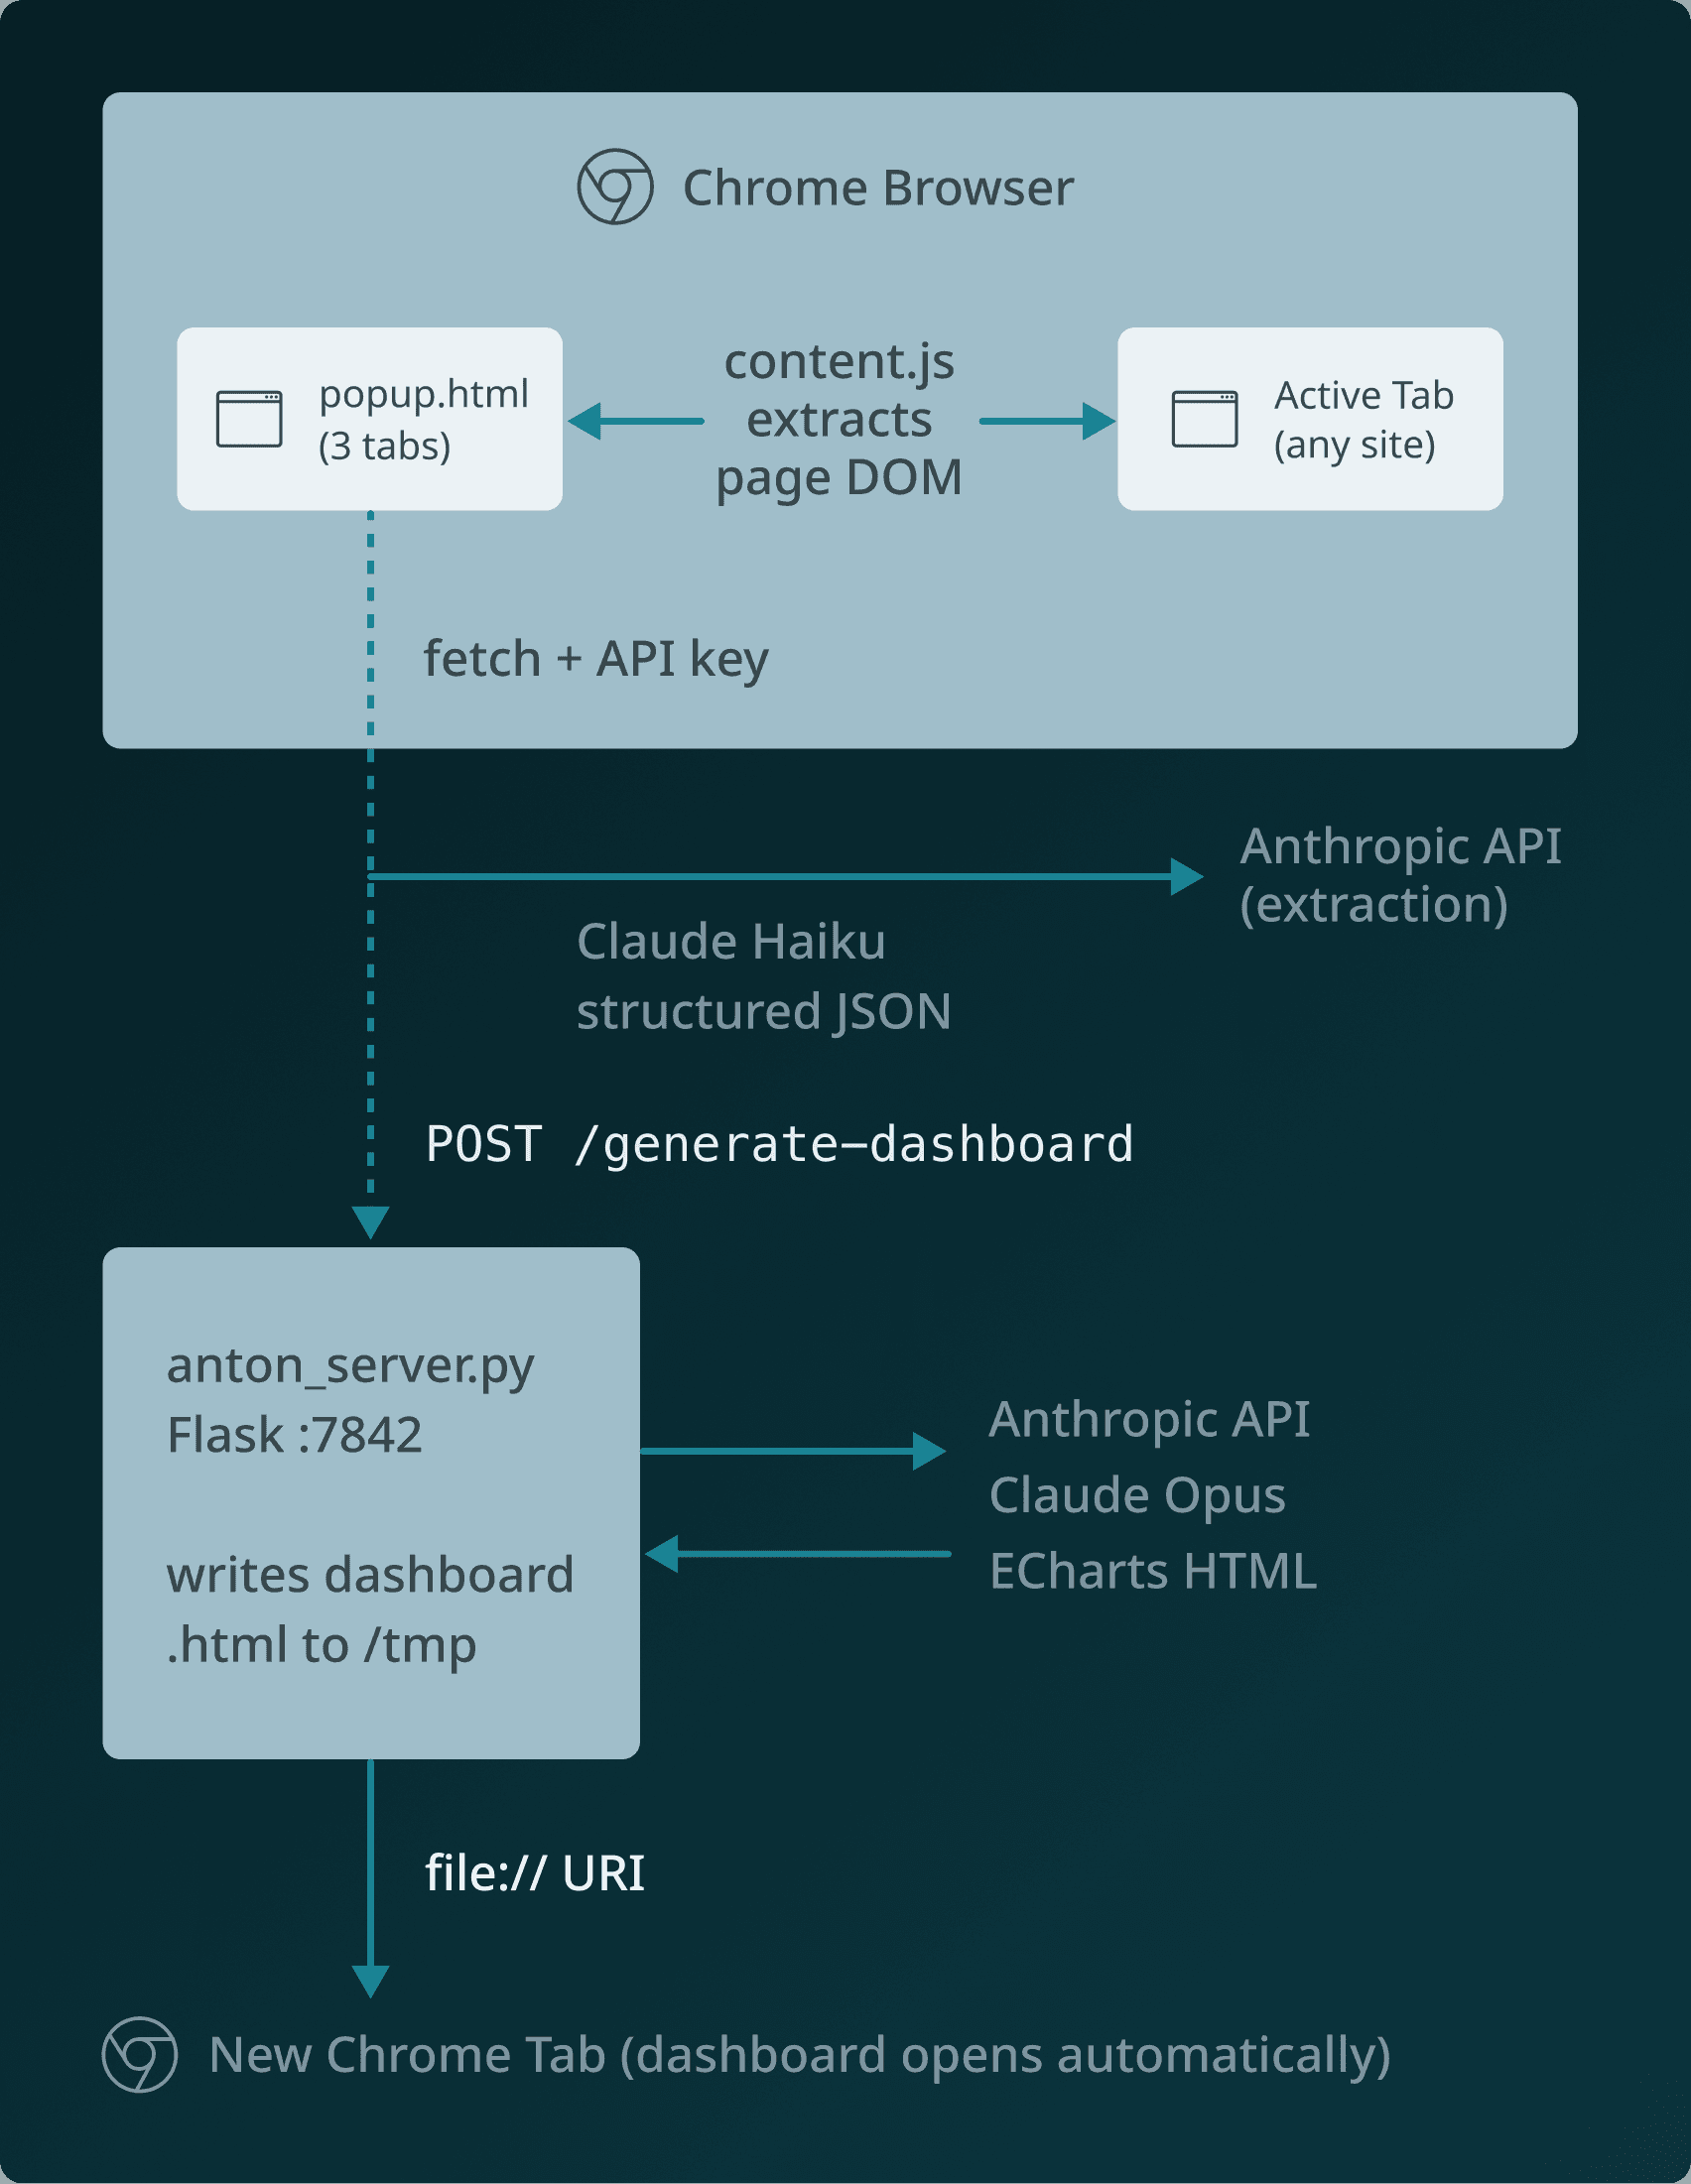
Option B: keep extraction inside the extension, but route dashboard generation to a local Flask server using a stronger model.
It recommended Option B for one reason that mattered: the workloads are different.
Extraction is frequent and latency-sensitive.
Dashboard generation is one-shot and quality-sensitive.
So we split models by job:
Haiku for extraction speed/cost.
Opus for richer dashboard generation.
That decision improved output quality immediately.
anton-scraper/
├── manifest.json
├── popup.html
├── popup.js
├── content.js
├── background.js
├── icons/
│   ├── icon16.png
│   ├── icon48.png
│   └── icon128.png
├── anton_server.py
├── requirements.txt
└── README.md
anton-scraper/
├── manifest.json
├── popup.html
├── popup.js
├── content.js
├── background.js
├── icons/
│   ├── icon16.png
│   ├── icon48.png
│   └── icon128.png
├── anton_server.py
├── requirements.txt
└── README.md
anton-scraper/
├── manifest.json
├── popup.html
├── popup.js
├── content.js
├── background.js
├── icons/
│   ├── icon16.png
│   ├── icon48.png
│   └── icon128.png
├── anton_server.py
├── requirements.txt
└── README.md
anton-scraper/
├── manifest.json
├── popup.html
├── popup.js
├── content.js
├── background.js
├── icons/
│   ├── icon16.png
│   ├── icon48.png
│   └── icon128.png
├── anton_server.py
├── requirements.txt
└── README.md
Final architecture:
The Product Flow (What Users Actually See)
The final experience is simple: Scrape → History → Settings → Dashboard
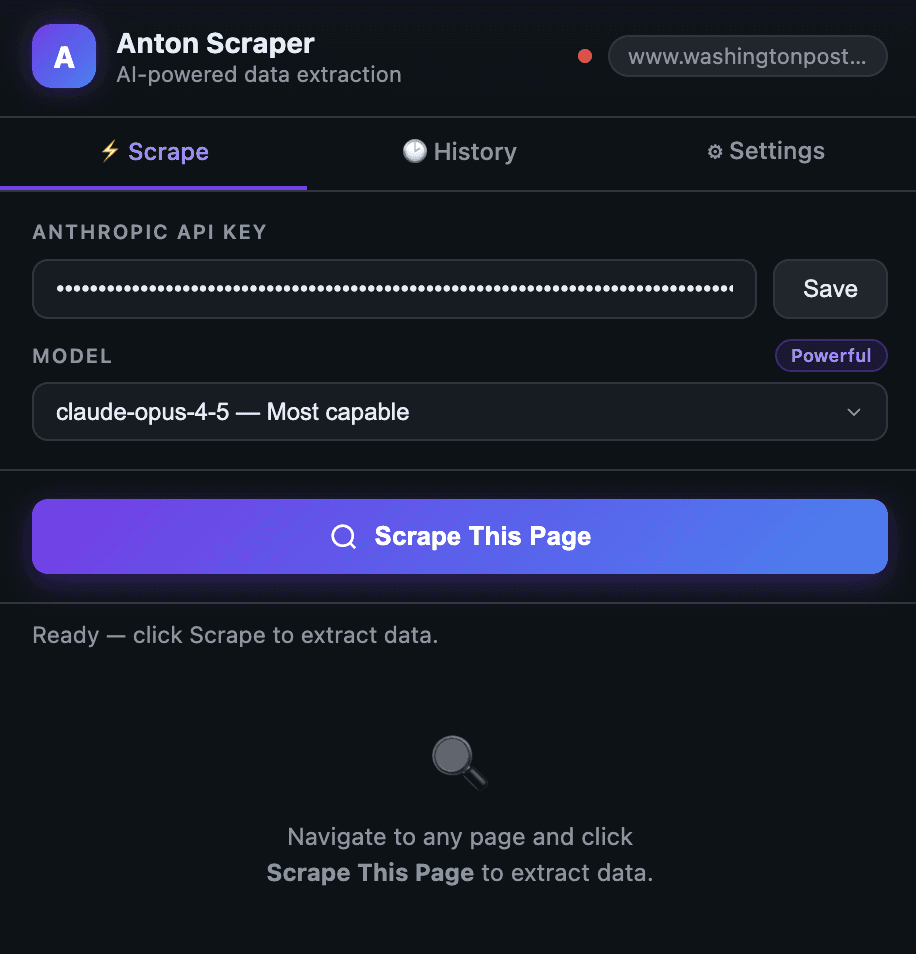
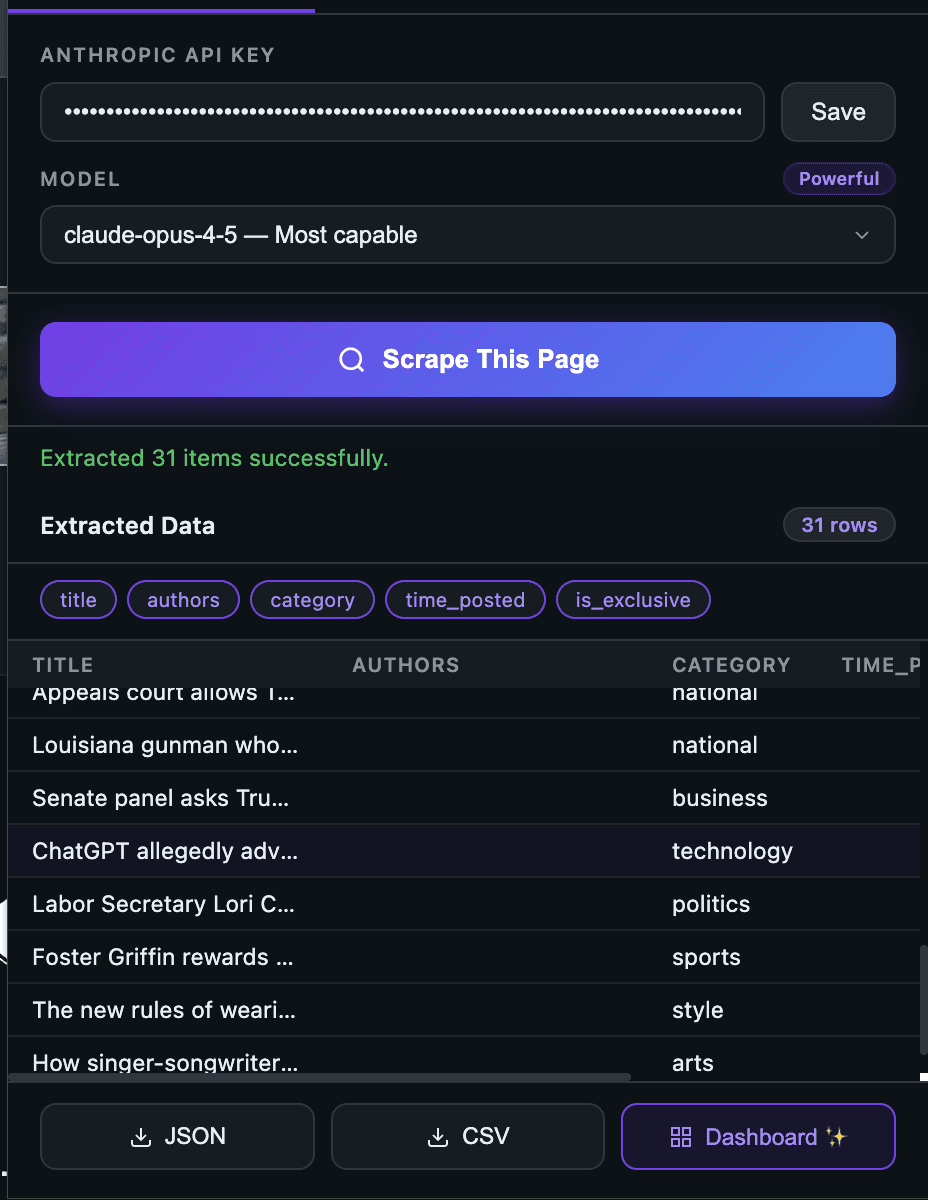
1) Scrape tab: configure once, extract fast
To use the scrape tab, you can seamlessly follow these steps:
Paste your Anthropic API key
Select a model
Click “Scrape This Page.”
The page is instantly converted into structured JSON.
Once you have selected the 'Scrape This Page' button, you will see the extracted details:
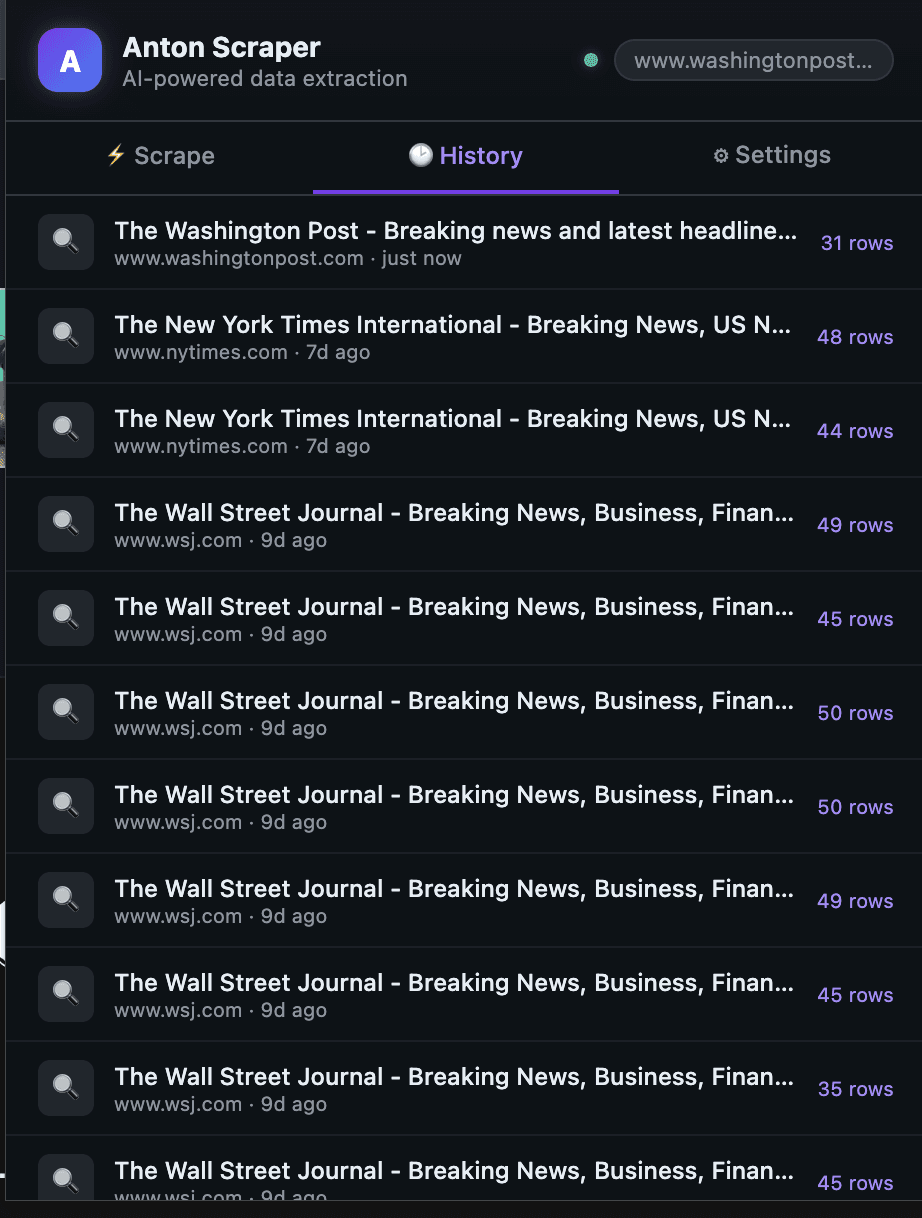
2) History tab: every run is replayable
Each scrape is stored with a timestamp and row count, so previous runs are one click away.
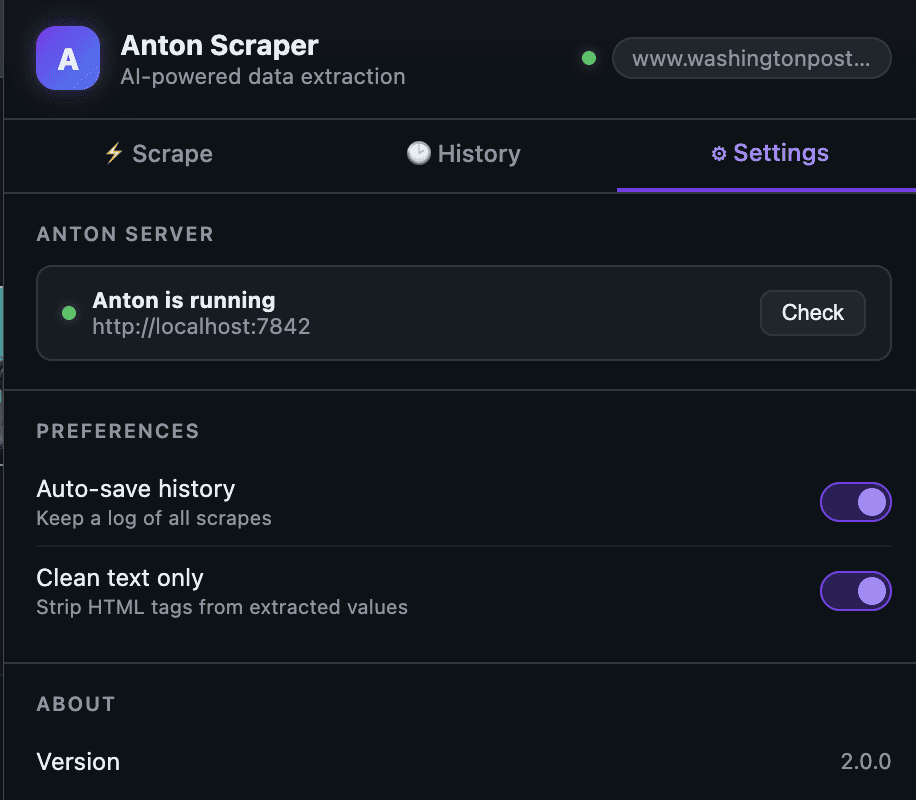
3) Settings tab: health checks and preferences
You can verify server status and control behavior (auto-save, clean text mode).
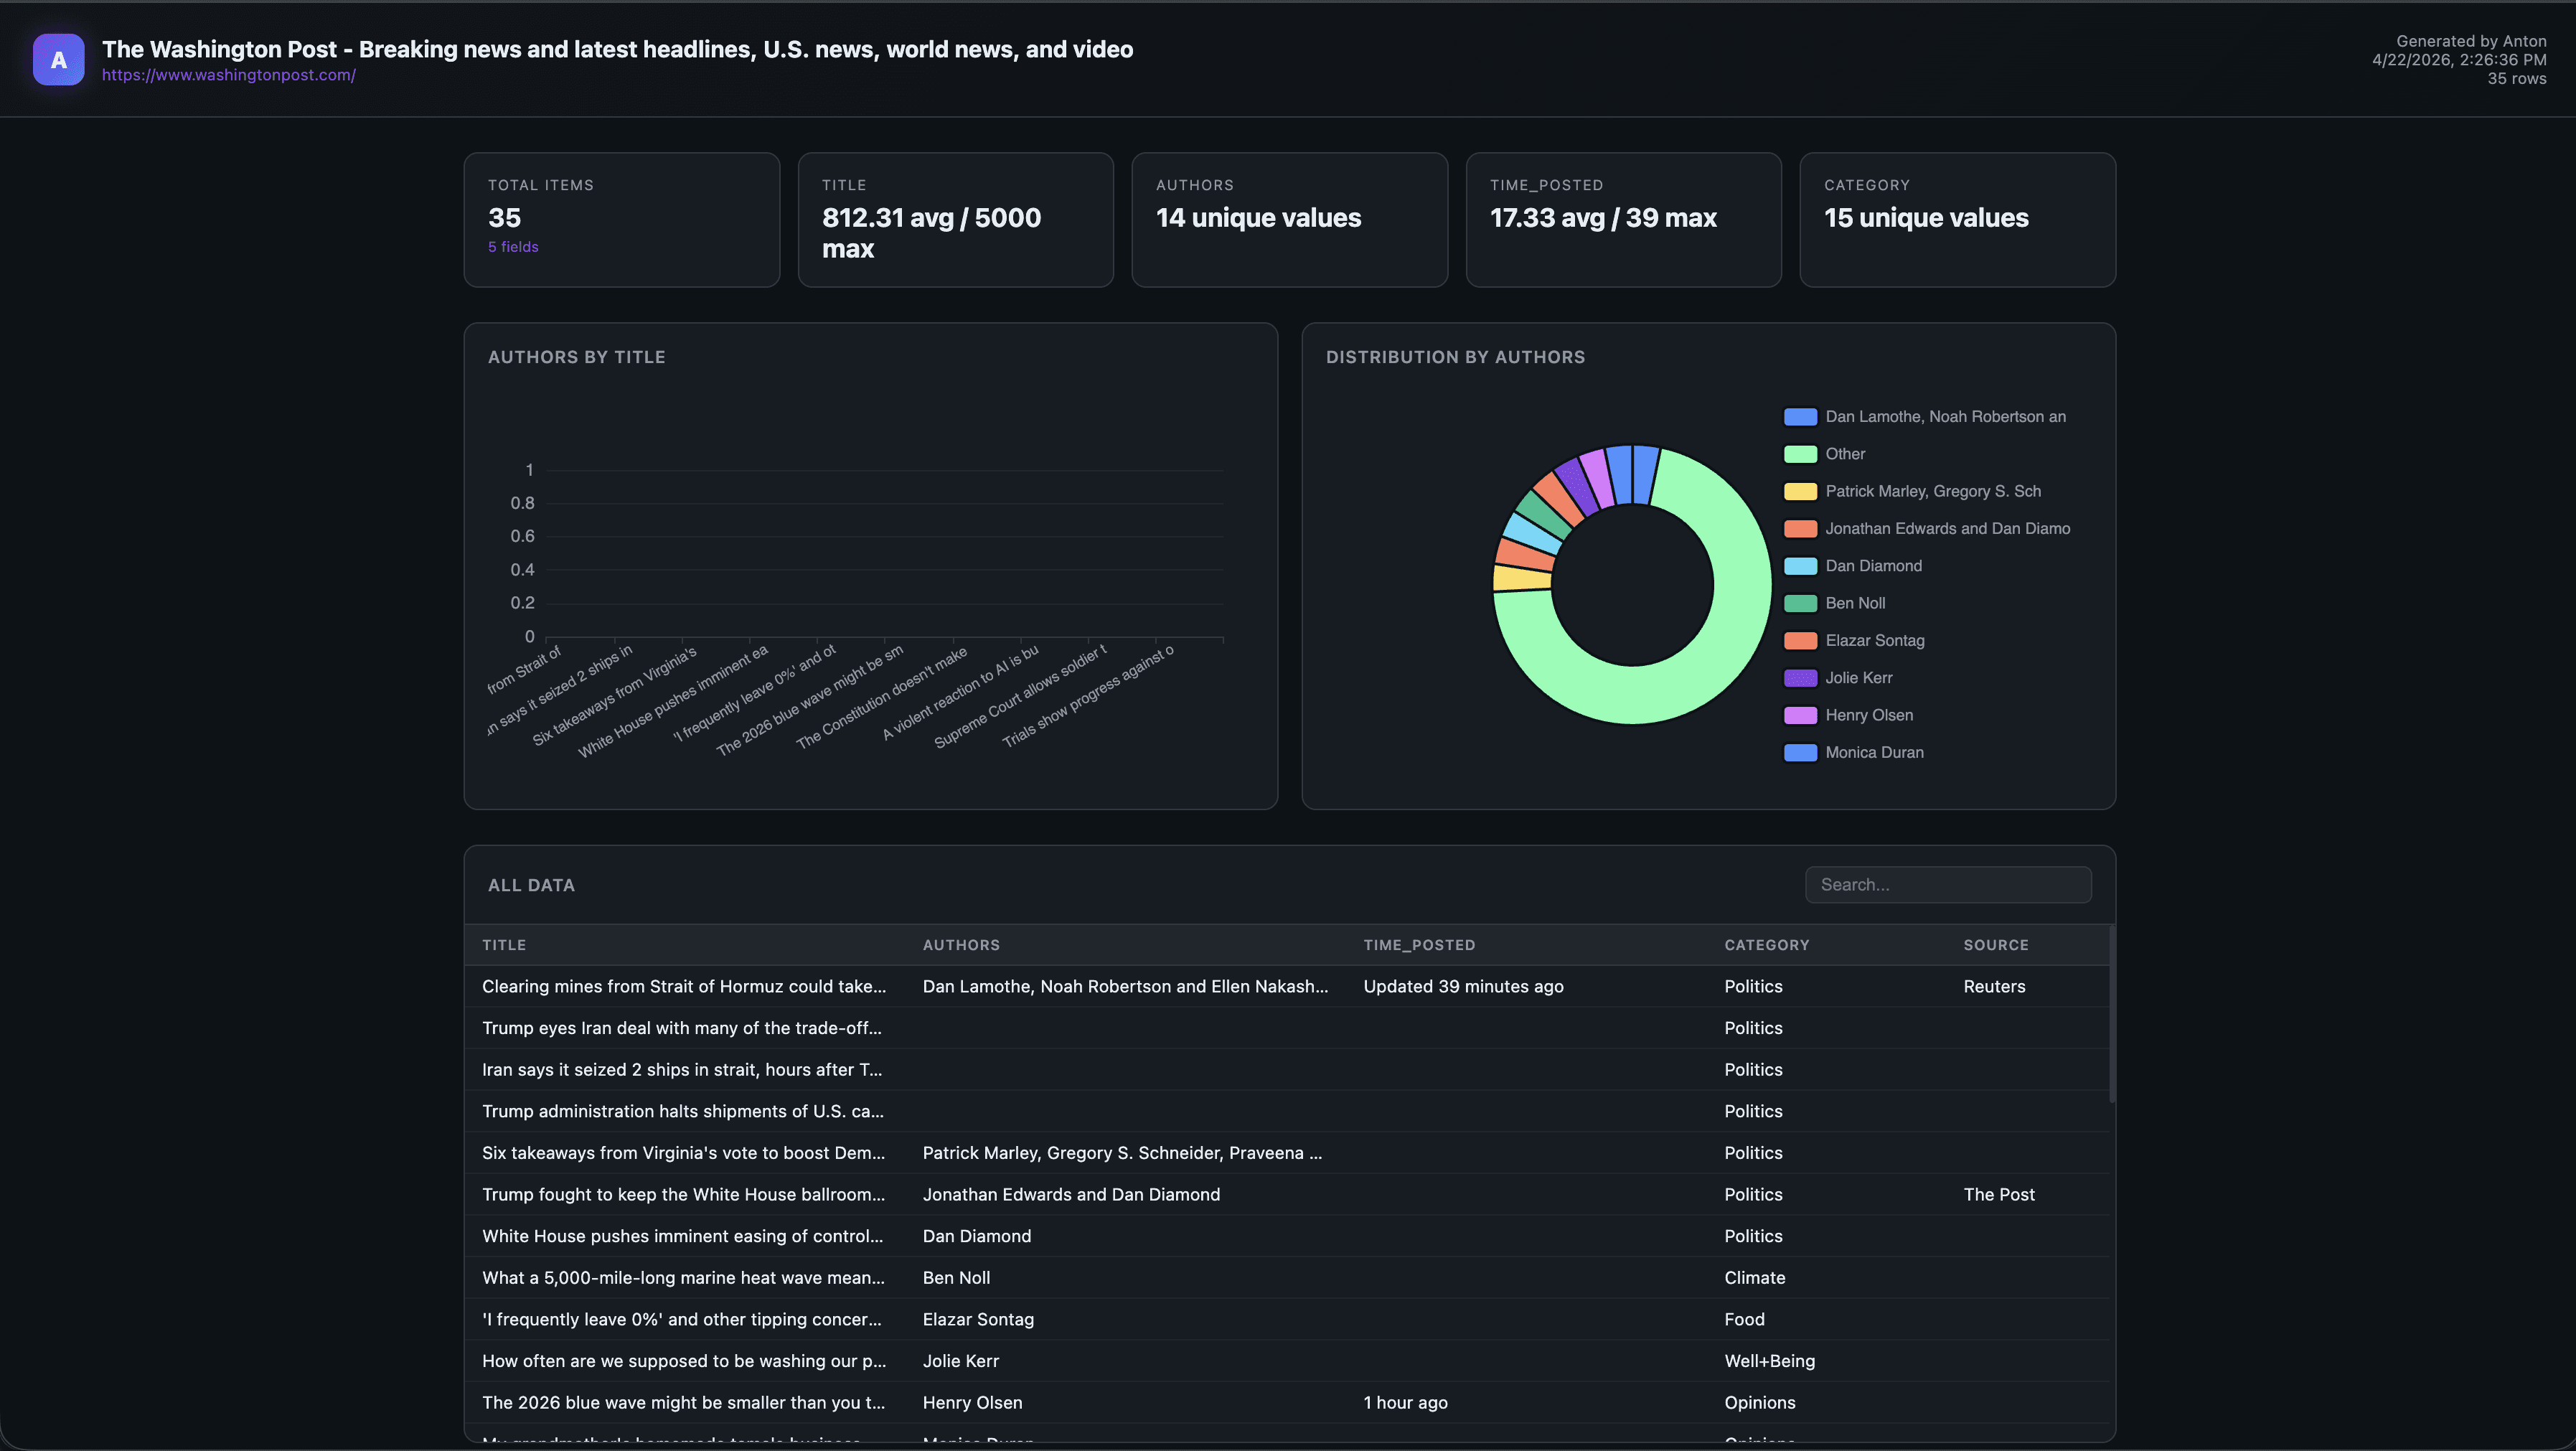
4) Dashboard output: one click to visual analysis
After the scrape success, the extension requests dashboard generation and opens a standalone ECharts report.
What Broke (Or Would Have) Without Agent Memory
A few things would have slowed this down significantly without agent reasoning:
1) CORS friction from extension -> localhost
Chrome extension popups calling localhost need explicit CORS handling. Anton added flask-cors before I asked.
anton_server.py (excerpt)
from flask import Flask, request, jsonify
from flask_cors import CORS
import anthropic, json, tempfile, os

app = Flask(__name__)
CORS(app)  # Allow chrome-extension:// origin

@app.route('/ping')
def ping():
    return jsonify({"status": "ok", "version": "2.0"})

@app.route('/generate-dashboard', methods=['POST'])
def generate_dashboard():
    data = request.json
    scraped_data = data.get('scraped_data')

    client = anthropic.Anthropic(api_key=os.environ.get('ANTHROPIC_API_KEY'))

    message = client.messages.create(
        model="claude-opus-4-5",
        max_tokens=4096,
        messages=[{
            "role": "user",
            "content": build_dashboard_prompt(scraped_data)
        }]
    )

    html_content = extract_html(message.content[0].text)

    with tempfile.NamedTemporaryFile(
        mode='w', suffix='.html', delete=False, dir='/tmp'
    ) as f:
        f.write(html_content)
        return jsonify({"path": f.name, "status": "ok"})
2) file:// open needs tabs permission
Without tabs, dashboard launch can fail silently in MV3. Anton patched manifest.json.
{
  "manifest_version": 3,
  "name": "Anton Scraper",
  "version": "2.0",
  "permissions": ["activeTab", "scripting", "storage", "tabs"],
  "host_permissions": [
    "http://localhost:7842/*",
    "https://api.anthropic.com/*"
  ]
}
{
  "manifest_version": 3,
  "name": "Anton Scraper",
  "version": "2.0",
  "permissions": ["activeTab", "scripting", "storage", "tabs"],
  "host_permissions": [
    "http://localhost:7842/*",
    "https://api.anthropic.com/*"
  ]
}
{
  "manifest_version": 3,
  "name": "Anton Scraper",
  "version": "2.0",
  "permissions": ["activeTab", "scripting", "storage", "tabs"],
  "host_permissions": [
    "http://localhost:7842/*",
    "https://api.anthropic.com/*"
  ]
}
{
  "manifest_version": 3,
  "name": "Anton Scraper",
  "version": "2.0",
  "permissions": ["activeTab", "scripting", "storage", "tabs"],
  "host_permissions": [
    "http://localhost:7842/*",
    "https://api.anthropic.com/*"
  ]
}
3) Prompt quality decides dashboard quality
The dashboard prompt forced the creation of a complete standalone HTML file with ECharts CDN and no runtime coupling.
def build_dashboard_prompt(data: dict) -> str:
    return f"""You are a data visualization expert. Given the following scraped data,
create a beautiful, interactive dashboard as a single self-contained HTML file.

Use Apache ECharts (load from CDN: https://cdn.jsdelivr.net/npm/echarts@5/dist/echarts.min.js).
The dashboard should:
- Have a dark theme with a professional look
- Include 2-4 appropriate chart types based on the data structure
- Show a data summary at the top
- Be fully self-contained (no external dependencies except the CDN)
- Render correctly when opened as a file:// URL

Scraped data:
{json.dumps(data, indent=2)}

Return ONLY the complete HTML. No explanation, no markdown fences."""
What This Enables
This isn’t just about building a Chrome extension. Most workflows that involve web data are still broken.
You find useful information on a page, but getting from that page to something usable takes too many steps: copying content, cleaning it, structuring it, loading it into another tool, and then finally building something visual.
It’s slow, repetitive, and disconnected. This project collapses that entire flow into one system.
Instead of: page → copy → clean → tool → dashboard
You get: page → scrape → structured data → dashboard
All in one pass.
More importantly, it removes the dependency on stitching tools together. You don’t need to jump between scrapers, spreadsheets, and BI tools just to answer a simple question.
It changes how you approach building software:
1. Faster time to working products
You go from idea → working feature in one session.
2. Less boilerplate, more decisions
The agent handles setup, wiring, and edge cases. You focus on what matters.
3. Built-in iteration loop
Because the agent remembers context, improvements compound across sessions.
4. End-to-end execution
Not just writing code- actually producing something usable.
In practice, it solves:
Time-to-insight delays: Going from raw data to something usable usually takes hours. Here, it takes minutes.
Fragmented workflows: No more switching between tools to extract, transform, and visualize data.
Manual data handling: Reduces the need for copying, cleaning, and formatting data by hand.
Prototyping friction: Lets you test ideas quickly without setting up full pipelines or infrastructure.
Access to insights: Makes it easier for non-specialists to turn web data into something they can actually use.
At a higher level, it solves a more important problem: The gap between finding data and doing something with it.
And once that gap disappears, speed becomes the default.
What "Autonomous" Actually Meant Here
In one run, Anton:
Read v1 and mapped gaps.
Proposed architecture and waited for a decision
Wrote extension + server files.
Generated missing icons because the manifest required them
Verified references and flow integrity.
Honest Assessment (No Hype)
This is not production-perfect…. yet.
file://output is practical, but serving HTML from Flask is cleaner.server startup is still manual (
python anton_server.py).local key handling and trust boundaries need a stricter security pass.
Still, the workflow shift is real:
less time writing boilerplate
more time making product decisions,
faster iteration from idea -> running feature
For me, that is the headline.
Final Thought
The interesting part isn’t that a Chrome extension got built in minutes- it’s that the bottleneck moved.
The hardest part wasn’t writing code. It was making decisions- what to build, how it should work, and what “good” looks like. Once that was clear, execution happened almost automatically- that’s the shift.
You’re no longer spending most of your time implementing. You’re defining problems, evaluating trade-offs, and guiding outcomes.
And when execution becomes this fast, the advantage isn’t who writes better code-it’s who makes better decisions, faster- that’s what this unlocks.
Our team is constantly pushing what Anton can do, and so should you. If you’d like to see Anton in action, contact our team.
What do most people think “AI coding” is? Basically smarter autocomplete.
That assumption doesn’t last long.
I built Anton Scraper v2.0 with Anton—an autonomous agent system built on top of Claude—and quickly realized this is something different.
This wasn’t line-by-line pair programming. This was closer to handing a scoped project to a technical teammate who can plan, execute, debug, and keep context from previous sessions.
In one run, Anton helped me ship a Chrome extension that:
Extracts structured data from any page
Stores scrape history
And generates a full interactive dashboard with one click
Why This Was Built
Most data workflows are still unnecessarily manual.
You find a page → copy data → clean it → load it into a tool → build charts → share results. It’s fragmented, slow, and repetitive. The goal here was simple: collapse that entire workflow into one flow.
From “I found something interesting on a page”
To “I have structured data and a usable dashboard”
…in minutes, not hours.
This project was also a way to test a bigger idea:
“Can an autonomous agent actually build and ship a usable product—not just assist with code?”
A quick summary on what happened and what you can expect:
The build took approximately 40 minutes from end to end.
The user experience follows a simple flow: scrape data, review history, adjust settings, and generate a dashboard with one click.
The system uses a split model approach, with Claude Haiku handling data extraction and Claude Opus responsible for dashboard generation.
Dashboard generation typically takes between 8 to 12 seconds after scraping is complete.
The biggest advantage was the speed of implementation.
The main risk is that the local server setup and API key handling still need to be hardened.
The Starting Point: Accessing Anton and Building the Chrome Extension
MindsDB Anton can be accessed by following the steps on Anton’s Github repository.
Onboarding:
Spin up Anton locally in one command and you’re ready to go:
On MacOS/Linux:
curl -sSf https://raw.githubusercontent.com/mindsdb/anton/main/install.sh | sh && export PATH="$HOME/.local/bin:$PATH"
Anton is also available as a Desktop App on Mac, you can download it here.
Or Windows:
irm https://raw.githubusercontent.com/mindsdb/anton/main/install.ps1 | iex
Once it is installed, you can run the following command to start Anton:
antonOn Anton’s start up screen, you will be prompted to choose an LLM Provider that will basically power everything.
Here we are choosing the 1st option- Minds-Enterprise-Cloud. This will give you access to various LLMs supported by Minds.
Once you have been onboarded with your LLM provider, you can go ahead and prompt Anton to build the Chrome extension.
Version 1 was already there. Anton had built a rough v1 in a previous session-functional, but not something you’d want to show anyone.
For v2, I asked for two things:
Refine the UI so it feels like a real product, not a prototype
Add dashboard generation-turn the scraped data into something visual
Here is the prompt provided to Anton to build the extension:
Chrome Extension

Manifest & Permissions:

 • Manifest v2, permissions: activeTab, scripting, storage, downloads, tabs
 • Host permissions for <all_urls>
 • Popup, background service worker, and content scripts injected on all URLs

Popup UI (popup.html):

 • Dark GitHub-style theme (#0d1117), 460px wide
 • Header with logo, a live status dot (green = local server online, red = offline), and a chip showing the current page URL
 • Three tabs: Scrape, History, Settings
 • Scrape tab:
    • Anthropic API key input + Save button (persisted in chrome.storage.local)
    • Model selector dropdown with fast / balanced / smart tiers (mapping to Claude Haiku, Sonnet, Opus)
    • "Scrape This Page" button with purple-to-blue gradient
    • Status bar with loading spinner
    • Results table with schema chips showing auto-detected fields, column filters
    • Download bar with JSON and CSV export
    • "Dashboard " button that sends scraped data to a local server to generate an ECharts dashboard
 • History tab: list of previous scrapes with one-click reload
 • Settings tab: toggles like autoHistory (default on)

Content Script (content.js):

 • Listen for GET_PAGE_CONTENT from the popup
 • Clone <body>, strip <script>, <style>, <nav>, <footer>, <iframe>, <noscript>, <header>
 • Return cleaned text truncated to 12,000 characters

Background (background.js):

 • On install, set autoHistory: true in chrome.storage.local

Popup Logic (popup.js):

 • On scrape: get cleaned page text → send to Claude API → display structured JSON in the results table → auto-save to history
 • Dashboard button: POST data + URL + title + API key to http://localhost:7842/generate-dashboard → open the returned file:// URI in a new tab

----------------------------------------------------------------------------------

Local Python Server (server/anton_server.py)

Flask + flask-cors on port 7842:

 • GET /ping — health check (drives the green/red dot in the extension)
 • POST /generate-dashboard — accepts { data[
Before writing a single line of code, Anton paused and pushed for an architecture decision
The Architecture Decision
Anton proposed two options:
Option A: keep everything inside the extension.
Option B: keep extraction inside the extension, but route dashboard generation to a local Flask server using a stronger model.
It recommended Option B for one reason that mattered: the workloads are different.
Extraction is frequent and latency-sensitive.
Dashboard generation is one-shot and quality-sensitive.
So we split models by job:
Haiku for extraction speed/cost.
Opus for richer dashboard generation.
That decision improved output quality immediately.
anton-scraper/
├── manifest.json
├── popup.html
├── popup.js
├── content.js
├── background.js
├── icons/
│   ├── icon16.png
│   ├── icon48.png
│   └── icon128.png
├── anton_server.py
├── requirements.txt
└── README.md
Final architecture:
The Product Flow (What Users Actually See)
The final experience is simple: Scrape → History → Settings → Dashboard
1) Scrape tab: configure once, extract fast
To use the scrape tab, you can seamlessly follow these steps:
Paste your Anthropic API key
Select a model
Click “Scrape This Page.”
The page is instantly converted into structured JSON.
Once you have selected the 'Scrape This Page' button, you will see the extracted details:
2) History tab: every run is replayable
Each scrape is stored with a timestamp and row count, so previous runs are one click away.
3) Settings tab: health checks and preferences
You can verify server status and control behavior (auto-save, clean text mode).
4) Dashboard output: one click to visual analysis
After the scrape success, the extension requests dashboard generation and opens a standalone ECharts report.
What Broke (Or Would Have) Without Agent Memory
A few things would have slowed this down significantly without agent reasoning:
1) CORS friction from extension -> localhost
Chrome extension popups calling localhost need explicit CORS handling. Anton added flask-cors before I asked.
anton_server.py (excerpt)
from flask import Flask, request, jsonify
from flask_cors import CORS
import anthropic, json, tempfile, os

app = Flask(__name__)
CORS(app)  # Allow chrome-extension:// origin

@app.route('/ping')
def ping():
    return jsonify({"status": "ok", "version": "2.0"})

@app.route('/generate-dashboard', methods=['POST'])
def generate_dashboard():
    data = request.json
    scraped_data = data.get('scraped_data')

    client = anthropic.Anthropic(api_key=os.environ.get('ANTHROPIC_API_KEY'))

    message = client.messages.create(
        model="claude-opus-4-5",
        max_tokens=4096,
        messages=[{
            "role": "user",
            "content": build_dashboard_prompt(scraped_data)
        }]
    )

    html_content = extract_html(message.content[0].text)

    with tempfile.NamedTemporaryFile(
        mode='w', suffix='.html', delete=False, dir='/tmp'
    ) as f:
        f.write(html_content)
        return jsonify({"path": f.name, "status": "ok"})
2) file:// open needs tabs permission
Without tabs, dashboard launch can fail silently in MV3. Anton patched manifest.json.
{
  "manifest_version": 3,
  "name": "Anton Scraper",
  "version": "2.0",
  "permissions": ["activeTab", "scripting", "storage", "tabs"],
  "host_permissions": [
    "http://localhost:7842/*",
    "https://api.anthropic.com/*"
  ]
}
3) Prompt quality decides dashboard quality
The dashboard prompt forced the creation of a complete standalone HTML file with ECharts CDN and no runtime coupling.
def build_dashboard_prompt(data: dict) -> str:
    return f"""You are a data visualization expert. Given the following scraped data,
create a beautiful, interactive dashboard as a single self-contained HTML file.

Use Apache ECharts (load from CDN: https://cdn.jsdelivr.net/npm/echarts@5/dist/echarts.min.js).
The dashboard should:
- Have a dark theme with a professional look
- Include 2-4 appropriate chart types based on the data structure
- Show a data summary at the top
- Be fully self-contained (no external dependencies except the CDN)
- Render correctly when opened as a file:// URL

Scraped data:
{json.dumps(data, indent=2)}

Return ONLY the complete HTML. No explanation, no markdown fences."""
What This Enables
This isn’t just about building a Chrome extension. Most workflows that involve web data are still broken.
You find useful information on a page, but getting from that page to something usable takes too many steps: copying content, cleaning it, structuring it, loading it into another tool, and then finally building something visual.
It’s slow, repetitive, and disconnected. This project collapses that entire flow into one system.
Instead of: page → copy → clean → tool → dashboard
You get: page → scrape → structured data → dashboard
All in one pass.
More importantly, it removes the dependency on stitching tools together. You don’t need to jump between scrapers, spreadsheets, and BI tools just to answer a simple question.
It changes how you approach building software:
1. Faster time to working products
You go from idea → working feature in one session.
2. Less boilerplate, more decisions
The agent handles setup, wiring, and edge cases. You focus on what matters.
3. Built-in iteration loop
Because the agent remembers context, improvements compound across sessions.
4. End-to-end execution
Not just writing code- actually producing something usable.
In practice, it solves:
Time-to-insight delays: Going from raw data to something usable usually takes hours. Here, it takes minutes.
Fragmented workflows: No more switching between tools to extract, transform, and visualize data.
Manual data handling: Reduces the need for copying, cleaning, and formatting data by hand.
Prototyping friction: Lets you test ideas quickly without setting up full pipelines or infrastructure.
Access to insights: Makes it easier for non-specialists to turn web data into something they can actually use.
At a higher level, it solves a more important problem: The gap between finding data and doing something with it.
And once that gap disappears, speed becomes the default.
What "Autonomous" Actually Meant Here
In one run, Anton:
Read v1 and mapped gaps.
Proposed architecture and waited for a decision
Wrote extension + server files.
Generated missing icons because the manifest required them
Verified references and flow integrity.
Honest Assessment (No Hype)
This is not production-perfect…. yet.
file://output is practical, but serving HTML from Flask is cleaner.server startup is still manual (
python anton_server.py).local key handling and trust boundaries need a stricter security pass.
Still, the workflow shift is real:
less time writing boilerplate
more time making product decisions,
faster iteration from idea -> running feature
For me, that is the headline.
Final Thought
The interesting part isn’t that a Chrome extension got built in minutes- it’s that the bottleneck moved.
The hardest part wasn’t writing code. It was making decisions- what to build, how it should work, and what “good” looks like. Once that was clear, execution happened almost automatically- that’s the shift.
You’re no longer spending most of your time implementing. You’re defining problems, evaluating trade-offs, and guiding outcomes.
And when execution becomes this fast, the advantage isn’t who writes better code-it’s who makes better decisions, faster- that’s what this unlocks.
Our team is constantly pushing what Anton can do, and so should you. If you’d like to see Anton in action, contact our team.
Products
Open Source
© 2026 All rights reserved by MindsDB.

Start conversational analytics with MindsDB
Production-ready infrastructure for agentic analytics
Start conversational analytics with MindsDB
Production-ready infrastructure for agentic analytics

Products
Open Source
© 2026 All rights reserved by MindsDB.

Products
Open Source
© 2026 All rights reserved by MindsDB.
Start conversational analytics with MindsDB
Production-ready infrastructure for agentic analytics